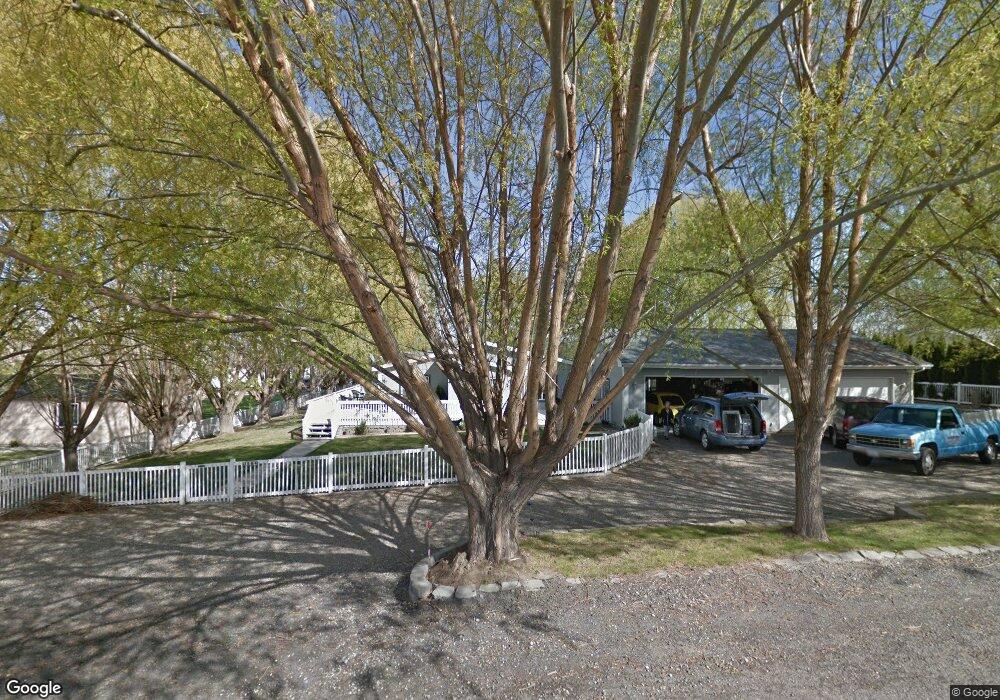
864 Bretz Rd Richland, WA 99352
Estimated Value: $402,000 - $565,000
3
Beds
2
Baths
2,004
Sq Ft
$239/Sq Ft
Est. Value
About This Home
This home is located at 864 Bretz Rd, Richland, WA 99352 and is currently estimated at $478,640, approximately $238 per square foot. 864 Bretz Rd is a home located in Benton County with nearby schools including White Bluffs Elementary School, Enterprise Middle School, and Richland High School.
Ownership History
Date
Name
Owned For
Owner Type
Purchase Details
Closed on
Apr 6, 2020
Sold by
Hubbell Michael
Bought by
Velasco Michelle J and Velasco Christian
Current Estimated Value
Home Financials for this Owner
Home Financials are based on the most recent Mortgage that was taken out on this home.
Original Mortgage
$324,022
Outstanding Balance
$287,044
Interest Rate
3.4%
Mortgage Type
FHA
Estimated Equity
$191,596
Purchase Details
Closed on
Dec 7, 2016
Sold by
Moor Janet L
Bought by
Moor Janet L
Purchase Details
Closed on
Sep 23, 2008
Sold by
Harris Trent
Bought by
Moor Thomas and Moor Janet L
Purchase Details
Closed on
Nov 26, 2007
Sold by
Godfrey Jimmy L and Godfrey Sheila R
Bought by
Harris Trent
Home Financials for this Owner
Home Financials are based on the most recent Mortgage that was taken out on this home.
Original Mortgage
$199,863
Interest Rate
6.36%
Mortgage Type
Purchase Money Mortgage
Create a Home Valuation Report for This Property
The Home Valuation Report is an in-depth analysis detailing your home's value as well as a comparison with similar homes in the area
Home Values in the Area
Average Home Value in this Area
Purchase History
| Date | Buyer | Sale Price | Title Company |
|---|---|---|---|
| Velasco Michelle J | $278,437 | Ticor Title Company | |
| Moor Janet L | -- | None Available | |
| Moor Thomas | $186,007 | Benton Franklin Title Co | |
| Harris Trent | $174,489 | Benton Franklin Titl |
Source: Public Records
Mortgage History
| Date | Status | Borrower | Loan Amount |
|---|---|---|---|
| Open | Velasco Michelle J | $324,022 | |
| Previous Owner | Harris Trent | $199,863 |
Source: Public Records
Tax History Compared to Growth
Tax History
| Year | Tax Paid | Tax Assessment Tax Assessment Total Assessment is a certain percentage of the fair market value that is determined by local assessors to be the total taxable value of land and additions on the property. | Land | Improvement |
|---|---|---|---|---|
| 2024 | $3,049 | $275,520 | $85,000 | $190,520 |
| 2023 | $3,049 | $286,410 | $85,000 | $201,410 |
| 2022 | $3,254 | $270,080 | $85,000 | $185,080 |
| 2021 | $3,036 | $264,640 | $85,000 | $179,640 |
| 2020 | $3,155 | $237,420 | $85,000 | $152,420 |
| 2019 | $2,347 | $237,420 | $85,000 | $152,420 |
| 2018 | $2,628 | $186,680 | $40,000 | $146,680 |
| 2017 | $2,326 | $182,320 | $40,000 | $142,320 |
| 2016 | $3,567 | $182,320 | $40,000 | $142,320 |
| 2015 | $3,600 | $182,320 | $40,000 | $142,320 |
| 2014 | -- | $182,320 | $40,000 | $142,320 |
| 2013 | -- | $182,320 | $40,000 | $142,320 |
Source: Public Records
Map
Nearby Homes
- 20906 Bretz Prairie NE
- 28509 Dallas Rd
- 4949 Rau Ln
- 900 Cayuse Dr
- 28605 Dallas Rd
- 3700 Arena Rd
- 1004 Sirron Ave
- 1020 Chinook Dr
- 1007 Makah Ct Unit Lot 1
- 1058 Klikitat St
- 1023 Makah Ct Unit Lot 2
- 1063 Klamath Ct
- 1055 Makah Ct Unit Lot 4
- 4529 Grove Ct
- 1056 Makah Ct
- 4545 Grove Ct
- 1072 Makah Ct
- 4537 Grove Ct
- 3807 E Lattin Rd
- 4361 Cowlitz Blvd
- 864 N Bretz Prne
- 852 Bretz Rd
- 852 Bretz Rd Unit Large clean lot with
- 879 Bretz Rd
- 840 Bretz Rd
- 888 Bretz Rd
- 847 Bretz Rd
- 4680 Rau St
- 29433 Dallas Rd
- 839 Bretz Rd
- 839 Bretz Rd Unit 1.19 acre in Town
- 4880 Rau St
- 827 Bretz Rd
- 824 Bretz Rd
- 4851 Rau Ln
- 4851 Rau Ln
- 819 Bretz Rd
- 889 Cayuse Dr
- 4762 Sioux Ct
- 4762 Sioux Ct Unit White Bluffs Phase 3