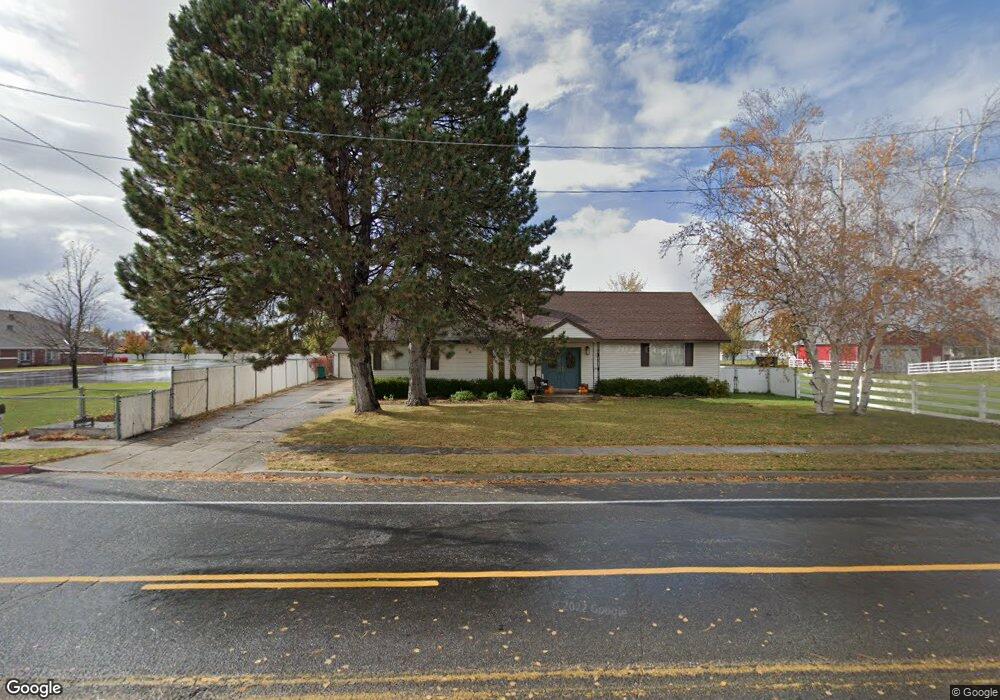
864 Flint St Layton, UT 84041
Estimated Value: $469,000 - $713,000
3
Beds
2
Baths
2,442
Sq Ft
$222/Sq Ft
Est. Value
About This Home
This home is located at 864 Flint St, Layton, UT 84041 and is currently estimated at $540,963, approximately $221 per square foot. 864 Flint St is a home located in Davis County with nearby schools including Layton Elementary School, Fairfield Junior High School, and Davis High School.
Ownership History
Date
Name
Owned For
Owner Type
Purchase Details
Closed on
Mar 2, 2018
Sold by
Birdsall Jamie Lyn
Bought by
Birdsall Jamie L
Current Estimated Value
Home Financials for this Owner
Home Financials are based on the most recent Mortgage that was taken out on this home.
Original Mortgage
$166,000
Outstanding Balance
$141,148
Interest Rate
4.15%
Mortgage Type
New Conventional
Estimated Equity
$399,815
Purchase Details
Closed on
Dec 22, 2008
Sold by
Birdsall Kenneth B
Bought by
Birdsall Kenneth B and Birdsall Jamie
Home Financials for this Owner
Home Financials are based on the most recent Mortgage that was taken out on this home.
Original Mortgage
$164,000
Interest Rate
6.1%
Mortgage Type
Purchase Money Mortgage
Purchase Details
Closed on
Nov 7, 2007
Sold by
Hill Ruel F
Bought by
Jackson Ronald Lynn
Purchase Details
Closed on
Aug 22, 2000
Sold by
Christensen Van H and Christensen Christine T
Bought by
Hill Ruel F and Hill Norene J
Create a Home Valuation Report for This Property
The Home Valuation Report is an in-depth analysis detailing your home's value as well as a comparison with similar homes in the area
Home Values in the Area
Average Home Value in this Area
Purchase History
| Date | Buyer | Sale Price | Title Company |
|---|---|---|---|
| Birdsall Jamie L | -- | -- | |
| Birdsall Kenneth B | -- | None Available | |
| Birdsall Kenneth B | -- | None Available | |
| Jackson Ronald Lynn | -- | Metro National Title | |
| Hill Ruel F | -- | Security Title Company |
Source: Public Records
Mortgage History
| Date | Status | Borrower | Loan Amount |
|---|---|---|---|
| Open | Birdsall Jamie L | $166,000 | |
| Previous Owner | Birdsall Kenneth B | $164,000 | |
| Previous Owner | Birdsall Kenneth B | $2,000 |
Source: Public Records
Tax History
| Year | Tax Paid | Tax Assessment Tax Assessment Total Assessment is a certain percentage of the fair market value that is determined by local assessors to be the total taxable value of land and additions on the property. | Land | Improvement |
|---|---|---|---|---|
| 2025 | $2,337 | $245,300 | $123,902 | $121,398 |
| 2024 | $2,252 | $238,150 | $134,239 | $103,911 |
| 2023 | $2,050 | $382,000 | $138,534 | $243,466 |
| 2022 | $2,217 | $224,400 | $82,795 | $141,605 |
| 2021 | $1,948 | $294,000 | $124,191 | $169,809 |
| 2020 | $1,775 | $257,000 | $105,497 | $151,503 |
| 2019 | $1,657 | $235,000 | $105,815 | $129,185 |
| 2018 | $1,482 | $211,000 | $93,075 | $117,925 |
| 2016 | $1,542 | $113,300 | $39,081 | $74,219 |
| 2015 | $1,470 | $102,520 | $39,081 | $63,439 |
| 2014 | $1,636 | $116,666 | $39,081 | $77,585 |
| 2013 | -- | $98,953 | $37,058 | $61,895 |
Source: Public Records
Map
Nearby Homes
- 80 E 850 S
- 799 S 125 E
- 949 S 225 E
- 948 S 250 E
- 282 E 925 S
- 1460 W Pleasant View Dr Unit 7
- 1435 W Pleasant View Dr Unit 37
- 1439 W Pleasant View Dr Unit 35
- 1440 W Pleasant View Dr Unit 3
- 753 S 300 E
- 765 W Farming Way
- 2011 Hill St
- 189 S Main St Unit 76
- 189 S Main St Unit 21
- 389 Morgan St
- 186 N Mountain Vistas Rd
- 2052 W Phillips St
- 2056 W Phillips St
- 1048 S Old Towne Rd
- 706 S 600 E
Your Personal Tour Guide
Ask me questions while you tour the home.