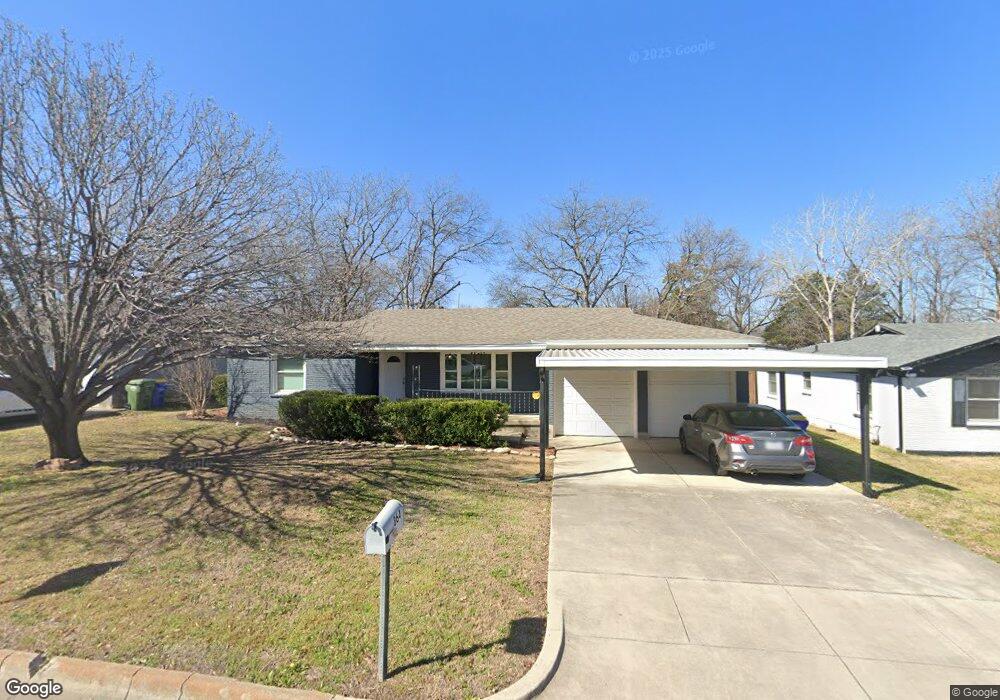
864 June Dr Fort Worth, TX 76108
Estimated Value: $232,000 - $240,218
3
Beds
2
Baths
1,374
Sq Ft
$171/Sq Ft
Est. Value
About This Home
This home is located at 864 June Dr, Fort Worth, TX 76108 and is currently estimated at $235,055, approximately $171 per square foot. 864 June Dr is a home located in Tarrant County with nearby schools including Liberty Elementary School, Brewer Middle School, and Tannahill Intermediate School.
Ownership History
Date
Name
Owned For
Owner Type
Purchase Details
Closed on
Apr 16, 2025
Sold by
Rhf June
Bought by
Villa Evencia and Martinez Alexis
Current Estimated Value
Home Financials for this Owner
Home Financials are based on the most recent Mortgage that was taken out on this home.
Original Mortgage
$220
Outstanding Balance
$219
Interest Rate
6.63%
Mortgage Type
Seller Take Back
Estimated Equity
$234,836
Purchase Details
Closed on
Oct 8, 2024
Sold by
Talbot Leslie
Bought by
Rhf June
Purchase Details
Closed on
Mar 14, 2023
Sold by
Rhf June
Bought by
Talbot Leslie Allison
Home Financials for this Owner
Home Financials are based on the most recent Mortgage that was taken out on this home.
Original Mortgage
$235,000
Interest Rate
6.09%
Mortgage Type
New Conventional
Create a Home Valuation Report for This Property
The Home Valuation Report is an in-depth analysis detailing your home's value as well as a comparison with similar homes in the area
Home Values in the Area
Average Home Value in this Area
Purchase History
| Date | Buyer | Sale Price | Title Company |
|---|---|---|---|
| Villa Evencia | -- | Patten Title Company | |
| Rhf June | -- | Patten Title Company | |
| Rhf June | -- | Patten Title Company | |
| Talbot Leslie Allison | -- | Patten Title Company |
Source: Public Records
Mortgage History
| Date | Status | Borrower | Loan Amount |
|---|---|---|---|
| Open | Villa Evencia | $220 | |
| Previous Owner | Talbot Leslie Allison | $235,000 |
Source: Public Records
Tax History Compared to Growth
Tax History
| Year | Tax Paid | Tax Assessment Tax Assessment Total Assessment is a certain percentage of the fair market value that is determined by local assessors to be the total taxable value of land and additions on the property. | Land | Improvement |
|---|---|---|---|---|
| 2025 | $5,037 | $212,621 | $43,550 | $169,071 |
| 2024 | $5,037 | $212,621 | $43,550 | $169,071 |
| 2023 | $5,326 | $223,998 | $43,550 | $180,448 |
| 2022 | $3,763 | $171,326 | $25,000 | $146,326 |
| 2021 | $3,474 | $156,071 | $25,000 | $131,071 |
| 2020 | $3,182 | $126,212 | $25,000 | $101,212 |
| 2019 | $3,003 | $123,320 | $25,000 | $98,320 |
| 2018 | $862 | $94,900 | $12,000 | $82,900 |
| 2017 | $2,521 | $90,346 | $12,000 | $78,346 |
| 2016 | $2,292 | $86,885 | $12,000 | $74,885 |
| 2015 | $680 | $71,300 | $10,000 | $61,300 |
| 2014 | $680 | $71,300 | $10,000 | $61,300 |
Source: Public Records
Map
Nearby Homes