
Seller's Agent in 2025
Cindy Laton
Century 21 Russ Hollins, Realtors
(704) 467-3595
4 in this area
106 Total Sales

Estimated Value: $358,760 - $377,000
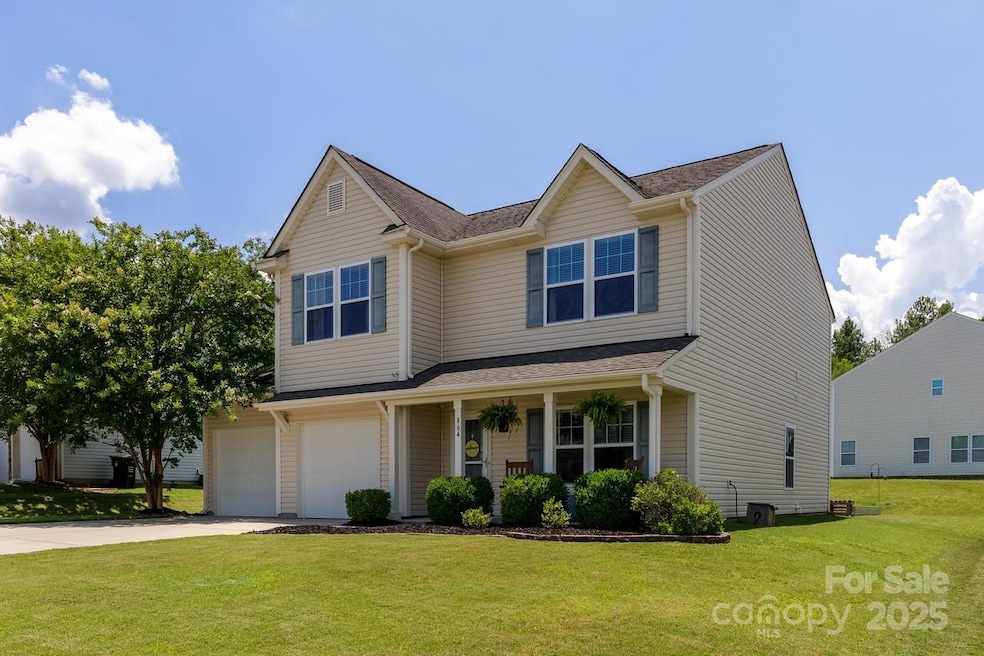
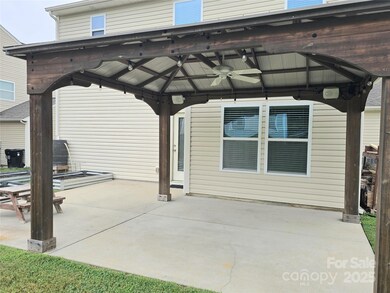
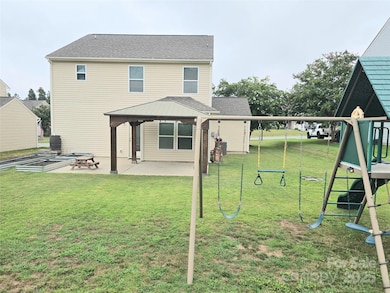
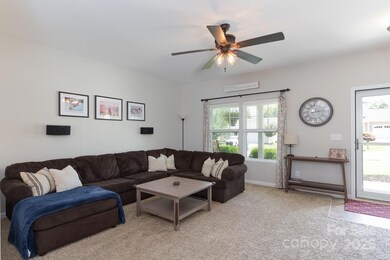
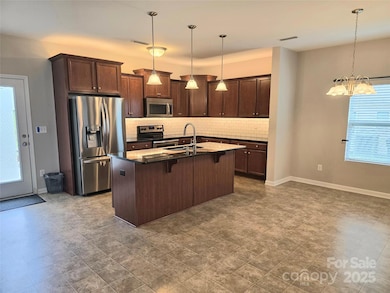
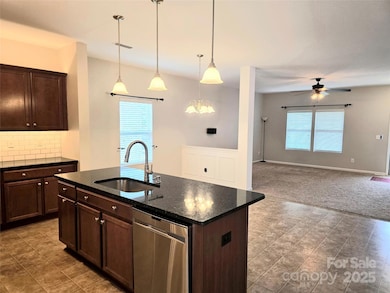
Spacious 3-bedroom, 2.5-bathroom home with a 2-car garage located in a serene, established neighborhood. The design includes a main floor home office or den, as well as a flexible upstairs space perfect for video games. Truly open floor plan with generous sight lines. The home is filled with soothing natural light from an intentional abundance of windows throughout. Enjoy extra spacious bedrooms and ample closet space. The convenient upstairs laundry is easily accessible from the bedrooms. Relax in the shade under the pergola right next to your grill! The thoughtful choice of exterior and interior color palettes complements the natural surroundings. This home is conveniently located near schools, shopping, parks, and trails. It's a must-see!
Last Agent to Sell the Property
Century 21 Russ Hollins, Realtors Brokerage Email: latoncindy@gmail.com License #170311 Listed on: 07/01/2025
We collect this data history from publicly available records. To have your information removed, we recommend requesting removal directly through your county’s website.
| Date | Buyer | Sale Price | Title Company |
|---|---|---|---|
| Knickerbocker Bryan D | $367,500 | None Listed On Document | |
| Salzmann Carl J | -- | None Available | |
| Salzman Carl J | $183,000 | None Available | |
| Tyson Mark R | $146,000 | None Available | |
| True Homes Llc | $26,000 | Independence Title |
We collect this data history from publicly available records. To have your information removed, we recommend requesting removal directly through your county’s website.
| Date | Status | Borrower | Loan Amount |
|---|---|---|---|
| Open | Knickerbocker Bryan D | $294,000 | |
| Previous Owner | Salzman Carl J | $5,325 | |
| Previous Owner | Tyson Mark R | $148,948 |
| Date | Event | Price | List to Sale | Price per Sq Ft |
|---|---|---|---|---|
| 10/22/2025 10/22/25 | Sold | $367,500 | 0.0% | $175 / Sq Ft |
| 08/25/2025 08/25/25 | Price Changed | $367,500 | -2.0% | $175 / Sq Ft |
| 07/31/2025 07/31/25 | Price Changed | $375,000 | -1.3% | $178 / Sq Ft |
| 07/18/2025 07/18/25 | Price Changed | $380,000 | -2.6% | $181 / Sq Ft |
| 07/01/2025 07/01/25 | For Sale | $390,000 | -- | $185 / Sq Ft |
| Year | Tax Paid | Tax Assessment Tax Assessment Total Assessment is a certain percentage of the fair market value that is determined by local assessors to be the total taxable value of land and additions on the property. | Land | Improvement |
|---|---|---|---|---|
| 2025 | $3,490 | $350,360 | $76,000 | $274,360 |
| 2024 | $3,490 | $350,360 | $76,000 | $274,360 |
| 2023 | $2,548 | $208,890 | $40,000 | $168,890 |
| 2022 | $2,548 | $208,890 | $40,000 | $168,890 |
| 2021 | $2,548 | $208,890 | $40,000 | $168,890 |
| 2020 | $2,548 | $208,890 | $40,000 | $168,890 |
| 2019 | $1,895 | $155,290 | $20,000 | $135,290 |
| 2018 | $1,863 | $155,290 | $20,000 | $135,290 |
| 2017 | $1,829 | $155,040 | $20,000 | $135,040 |
| 2016 | $1,085 | $149,340 | $20,000 | $129,340 |
| 2015 | $1,762 | $149,340 | $20,000 | $129,340 |
| 2014 | $1,762 | $149,340 | $20,000 | $129,340 |
Seller's Agent in 2025
Cindy Laton
Century 21 Russ Hollins, Realtors
(704) 467-3595
4 in this area
106 Total Sales
K
Buyer's Agent in 2025
Karen Pippin
Premier Sotheby's International Realty
(704) 840-5720
1 in this area
21 Total Sales
Source: Canopy MLS
MLS Number: 4276445
APN: 5538-52-2268-0000
Disclaimer: Certain information contained herein is derived from information provided by parties other than Homes.com. All information provided is deemed reliable, but is not guaranteed to be accurate and should be independently verified.
![]() All data is obtained from various sources and may not have been verified by broker or MLS GRID. Supplied Open House Information is subject to change without notice. All information should be independently reviewed and verified for accuracy. Properties may or may not be listed by the office/agent presenting the information. Some IDX listings have been excluded from this website.
All data is obtained from various sources and may not have been verified by broker or MLS GRID. Supplied Open House Information is subject to change without notice. All information should be independently reviewed and verified for accuracy. Properties may or may not be listed by the office/agent presenting the information. Some IDX listings have been excluded from this website.
Based on information submitted to the MLS GRID
Listings courtesy of Canopy MLS as distributed by MLS GRID
Ask me questions while you tour the home.