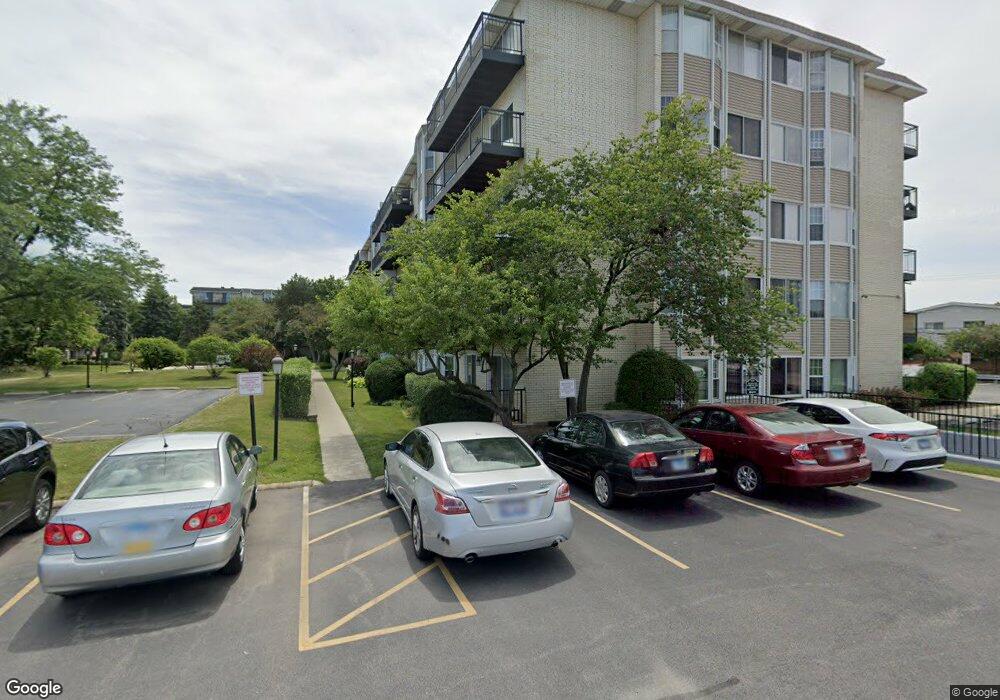
8640 Waukegan Rd Unit 432 Morton Grove, IL 60053
Estimated Value: $254,843 - $273,000
2
Beds
2
Baths
88,128
Sq Ft
$3/Sq Ft
Est. Value
About This Home
This home is located at 8640 Waukegan Rd Unit 432, Morton Grove, IL 60053 and is currently estimated at $264,211, approximately $2 per square foot. 8640 Waukegan Rd Unit 432 is a home located in Cook County with nearby schools including Hynes Elementary School, Golf Middle School, and Niles North High School.
Ownership History
Date
Name
Owned For
Owner Type
Purchase Details
Closed on
May 20, 2010
Sold by
Nusbaum Cary S and Nusbaum Bruce A
Bought by
Oshana Sam J
Current Estimated Value
Home Financials for this Owner
Home Financials are based on the most recent Mortgage that was taken out on this home.
Original Mortgage
$100,000
Interest Rate
4.83%
Mortgage Type
New Conventional
Purchase Details
Closed on
Mar 17, 2010
Sold by
Nusbaum Cary S
Bought by
Nusbaum Cary S and Nusbaum Bruce A
Purchase Details
Closed on
May 20, 1997
Sold by
Tucker Hobert A and Tucker Karen S
Bought by
Nusbaum Carol
Home Financials for this Owner
Home Financials are based on the most recent Mortgage that was taken out on this home.
Original Mortgage
$100,100
Interest Rate
8.27%
Create a Home Valuation Report for This Property
The Home Valuation Report is an in-depth analysis detailing your home's value as well as a comparison with similar homes in the area
Home Values in the Area
Average Home Value in this Area
Purchase History
| Date | Buyer | Sale Price | Title Company |
|---|---|---|---|
| Oshana Sam J | $145,000 | Stewart Title Company | |
| Nusbaum Cary S | -- | None Available | |
| Nusbaum Carol | $130,000 | Attorneys Natl Title Network |
Source: Public Records
Mortgage History
| Date | Status | Borrower | Loan Amount |
|---|---|---|---|
| Previous Owner | Oshana Sam J | $100,000 | |
| Previous Owner | Nusbaum Carol | $100,100 |
Source: Public Records
Tax History Compared to Growth
Tax History
| Year | Tax Paid | Tax Assessment Tax Assessment Total Assessment is a certain percentage of the fair market value that is determined by local assessors to be the total taxable value of land and additions on the property. | Land | Improvement |
|---|---|---|---|---|
| 2024 | $5,346 | $19,657 | $416 | $19,241 |
| 2023 | $5,108 | $19,657 | $416 | $19,241 |
| 2022 | $5,108 | $19,657 | $416 | $19,241 |
| 2021 | $4,166 | $14,068 | $292 | $13,776 |
| 2020 | $4,091 | $14,068 | $292 | $13,776 |
| 2019 | $4,102 | $15,703 | $292 | $15,411 |
| 2018 | $3,638 | $12,507 | $254 | $12,253 |
| 2017 | $3,651 | $12,507 | $254 | $12,253 |
| 2016 | $3,453 | $12,507 | $254 | $12,253 |
| 2015 | $3,371 | $11,136 | $215 | $10,921 |
| 2014 | $3,307 | $11,136 | $215 | $10,921 |
| 2013 | $3,250 | $11,136 | $215 | $10,921 |
Source: Public Records
Map
Nearby Homes
- 8661 N National Ave
- 8620 Waukegan Rd Unit 308
- 8725 N National Ave
- 7002 W Carol Ave
- 8536 Grove St
- 7020 W Wright Terrace
- 8650 N Shermer Rd Unit 102
- 8927 Belleforte Ave
- 8239 N New England Ave
- 6964 W Cleveland St
- 8760 N Oketo Ave
- 9131 Newcastle Ave
- 6901 Church St
- 9133 Oak Park Ave
- 8258 N Octavia Ave
- 7207 Church St
- 8341 N Osceola Ave
- 6346 Hennings Ct
- 8206 N Octavia Ave
- 6344 Hennings Ct
- 8640 Waukegan Rd Unit 225
- 8640 Waukegan Rd Unit 426
- 8640 Waukegan Rd Unit 526
- 8640 Waukegan Rd Unit 422
- 8640 Waukegan Rd Unit 531
- 8640 Waukegan Rd Unit 431
- 8640 Waukegan Rd Unit 224
- 8640 Waukegan Rd Unit 229
- 8640 Waukegan Rd Unit 327
- 8640 Waukegan Rd Unit 221
- 8640 Waukegan Rd Unit 122
- 8640 Waukegan Rd Unit 528
- 8640 Waukegan Rd Unit 523
- 8640 Waukegan Rd Unit 321
- 8640 Waukegan Rd Unit 132
- 8640 Waukegan Rd Unit 128
- 8640 Waukegan Rd Unit 131
- 8640 Waukegan Rd Unit 322
- 8640 Waukegan Rd Unit 123
- 8640 Waukegan Rd Unit 328