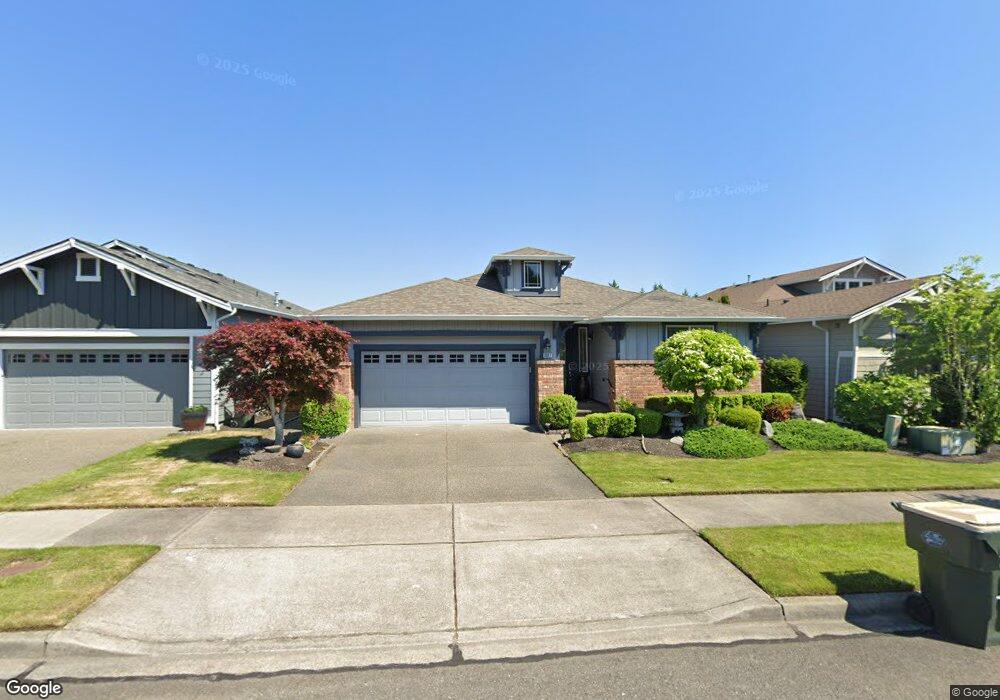
8641 Bainbridge Loop NE Lacey, WA 98516
Jubilee NeighborhoodEstimated Value: $660,000 - $751,000
2
Beds
2
Baths
2,254
Sq Ft
$314/Sq Ft
Est. Value
About This Home
This home is located at 8641 Bainbridge Loop NE, Lacey, WA 98516 and is currently estimated at $708,739, approximately $314 per square foot. 8641 Bainbridge Loop NE is a home located in Thurston County with nearby schools including Olympic View Elementary School, Chinook Middle School, and North Thurston High School.
Ownership History
Date
Name
Owned For
Owner Type
Purchase Details
Closed on
Jun 7, 2010
Sold by
Hussey David E and Hussey Audree J
Bought by
Lee Ki Chang and Lee Micheline
Current Estimated Value
Purchase Details
Closed on
Jul 25, 2007
Sold by
Albers James A and Albers Virginia M
Bought by
Hussey David E and Hussey Audree J
Home Financials for this Owner
Home Financials are based on the most recent Mortgage that was taken out on this home.
Original Mortgage
$417,000
Interest Rate
7.37%
Mortgage Type
Unknown
Purchase Details
Closed on
Apr 28, 2004
Sold by
Hawks Prairie Land Associates Llc
Bought by
Albers James A and Albers Virginia M
Home Financials for this Owner
Home Financials are based on the most recent Mortgage that was taken out on this home.
Original Mortgage
$272,580
Interest Rate
5.38%
Mortgage Type
Credit Line Revolving
Create a Home Valuation Report for This Property
The Home Valuation Report is an in-depth analysis detailing your home's value as well as a comparison with similar homes in the area
Home Values in the Area
Average Home Value in this Area
Purchase History
| Date | Buyer | Sale Price | Title Company |
|---|---|---|---|
| Lee Ki Chang | $450,000 | Chicago Title Company | |
| Hussey David E | $525,000 | First American Title | |
| Albers James A | $357,050 | First American Title |
Source: Public Records
Mortgage History
| Date | Status | Borrower | Loan Amount |
|---|---|---|---|
| Previous Owner | Hussey David E | $417,000 | |
| Previous Owner | Albers James A | $272,580 |
Source: Public Records
Tax History Compared to Growth
Tax History
| Year | Tax Paid | Tax Assessment Tax Assessment Total Assessment is a certain percentage of the fair market value that is determined by local assessors to be the total taxable value of land and additions on the property. | Land | Improvement |
|---|---|---|---|---|
| 2024 | $6,375 | $677,900 | $235,400 | $442,500 |
| 2023 | $6,375 | $667,100 | $213,900 | $453,200 |
| 2022 | $6,984 | $643,700 | $119,300 | $524,400 |
| 2021 | $6,261 | $600,800 | $109,500 | $491,300 |
| 2020 | $6,202 | $501,700 | $107,500 | $394,200 |
| 2019 | $5,600 | $516,400 | $136,500 | $379,900 |
| 2018 | $6,407 | $477,500 | $133,200 | $344,300 |
| 2017 | $5,670 | $445,500 | $122,300 | $323,200 |
| 2016 | $5,266 | $418,250 | $108,950 | $309,300 |
| 2014 | -- | $403,350 | $108,950 | $294,400 |
Source: Public Records
Map
Nearby Homes
- 8542 Bainbridge Loop NE
- 8650 Bainbridge Loop NE Unit 1
- 8218 Bainbridge Loop NE
- 8218 Camano Loop NE
- 8336 Bainbridge Loop NE
- 4212 Vashon Dr NE
- 4420 Vashon Dr NE
- 4100 Cashmere Dr NE
- 4379 Dudley Ct NE
- 8231 Orcas Loop NE
- 4351 Dudley Ct NE
- 4335 Dudley Dr NE
- 4433 Cashmere Dr NE
- 8265 Orcas Loop NE
- 3609 Lanyard Dr NE
- 3923 Jett Ln NE
- 4812 Spokane St NE
- 4340 Edgewater Blvd NE
- 3974 Cameron Dr NE
- 7623 Denali Ave NE
- 8645 Bainbridge Loop NE Unit 1
- 8633 Bainbridge Loop NE
- 8629 Bainbridge Loop NE Unit 1
- 8649 Bainbridge Loop NE Unit 1
- 8638 Bainbridge Loop NE
- 8625 Bainbridge Loop NE Unit 1
- 8642 Bainbridge Loop NE Unit 1
- 8632 Bainbridge Loop NE Unit 1
- 8653 Bainbridge Loop NE
- 8646 Bainbridge Loop NE
- 8628 Bainbridge Loop NE
- 8617 Bainbridge Loop NE
- 8701 Bainbridge Loop NE
- 8613 Bainbridge Loop NE Unit 1
- 8654 Bainbridge Loop NE Unit 1
- 8222 Bainbridge Loop NE
- 8224 Bainbridge Loop NE
- 8214 Bainbridge Loop NE Unit 2
- 8228 Bainbridge Loop NE
- 8609 Bainbridge Loop NE