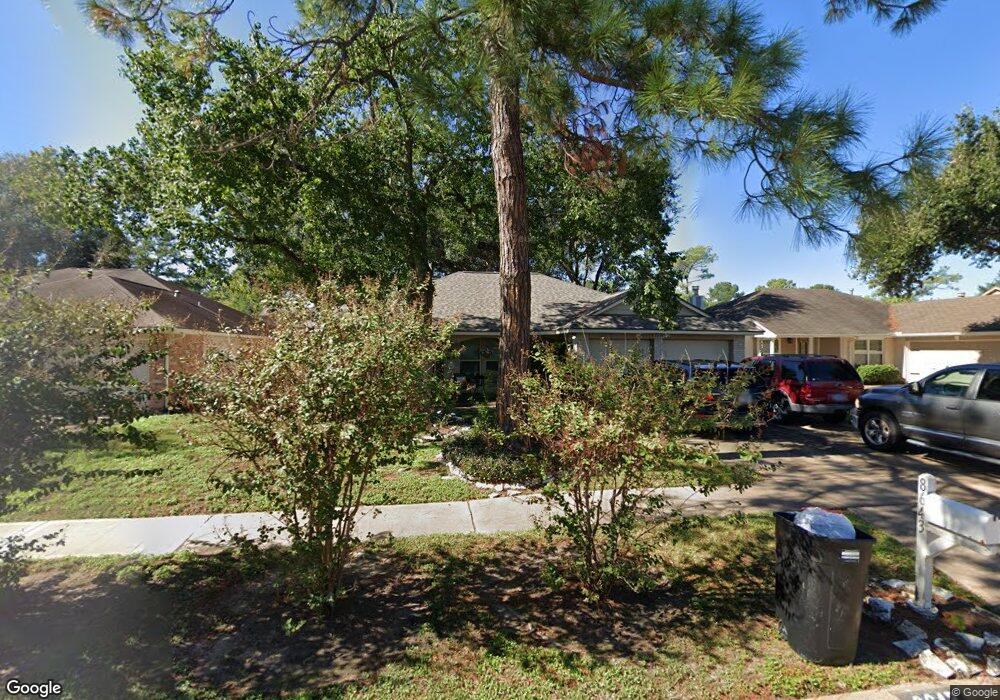
8643 Sunny Ridge Dr Houston, TX 77095
Estimated Value: $241,610 - $262,000
3
Beds
2
Baths
1,469
Sq Ft
$171/Sq Ft
Est. Value
About This Home
This home is located at 8643 Sunny Ridge Dr, Houston, TX 77095 and is currently estimated at $251,903, approximately $171 per square foot. 8643 Sunny Ridge Dr is a home located in Harris County with nearby schools including Fiest Elementary School, Labay Middle School, and Cypress Falls High School.
Ownership History
Date
Name
Owned For
Owner Type
Purchase Details
Closed on
Aug 25, 1999
Sold by
Townsend David L
Bought by
Fleming Cody R and Fleming Julie R
Current Estimated Value
Home Financials for this Owner
Home Financials are based on the most recent Mortgage that was taken out on this home.
Original Mortgage
$76,950
Outstanding Balance
$22,113
Interest Rate
7.65%
Estimated Equity
$229,790
Purchase Details
Closed on
Dec 17, 1998
Sold by
Bond Kevin Duane and Knight Karen Renee
Bought by
Townsend David L
Purchase Details
Closed on
Apr 28, 1995
Sold by
Stamps Robert W and Stamps Teresa L
Bought by
Bond Kevin Duane and Knight Karen Renee
Home Financials for this Owner
Home Financials are based on the most recent Mortgage that was taken out on this home.
Original Mortgage
$71,677
Interest Rate
8.36%
Mortgage Type
FHA
Create a Home Valuation Report for This Property
The Home Valuation Report is an in-depth analysis detailing your home's value as well as a comparison with similar homes in the area
Home Values in the Area
Average Home Value in this Area
Purchase History
| Date | Buyer | Sale Price | Title Company |
|---|---|---|---|
| Fleming Cody R | -- | Alamo Title 88 | |
| Townsend David L | -- | Alamo Title 40 | |
| Bond Kevin Duane | -- | -- |
Source: Public Records
Mortgage History
| Date | Status | Borrower | Loan Amount |
|---|---|---|---|
| Open | Fleming Cody R | $76,950 | |
| Previous Owner | Bond Kevin Duane | $71,677 |
Source: Public Records
Tax History Compared to Growth
Tax History
| Year | Tax Paid | Tax Assessment Tax Assessment Total Assessment is a certain percentage of the fair market value that is determined by local assessors to be the total taxable value of land and additions on the property. | Land | Improvement |
|---|---|---|---|---|
| 2025 | $2,739 | $242,025 | $70,375 | $171,650 |
| 2024 | $2,739 | $226,646 | $61,196 | $165,450 |
| 2023 | $2,739 | $237,865 | $61,196 | $176,669 |
| 2022 | $4,229 | $213,864 | $48,956 | $164,908 |
| 2021 | $4,050 | $174,460 | $48,956 | $125,504 |
| 2020 | $3,896 | $163,362 | $40,797 | $122,565 |
| 2019 | $3,949 | $160,198 | $33,998 | $126,200 |
| 2018 | $1,316 | $145,452 | $33,998 | $111,454 |
| 2017 | $3,209 | $139,903 | $33,998 | $105,905 |
| 2016 | $3,209 | $139,903 | $33,998 | $105,905 |
| 2015 | $2,160 | $134,834 | $33,998 | $100,836 |
| 2014 | $2,160 | $122,355 | $26,518 | $95,837 |
Source: Public Records
Map
Nearby Homes
- 8526 Greenleaf Lake Dr
- 15634 Haleys Landing Ln
- 15735 Jamie Lee Dr
- 15610 Tarpon Springs Ct
- 15610 Manorford Ct
- 15627 Kentwater Ct
- 15802 Aberdeen Trails Dr
- 9303 Reston Grove Ln
- 15611 Meadow Village Dr
- 8818 Apple Mill Dr
- 15414 Swan Creek Dr
- 15415 Swan Creek Dr
- 9111 Sunny Ridge Dr
- 15954 Oak Mountain Dr
- 15362 Meadow Village Dr
- 8306 Lake Crystal Dr
- 15906 Marwick Ct
- 9138 Shango Ln
- 8550 Sparkling Springs Dr
- 8526 Hot Springs Dr
- 8647 Sunny Ridge Dr
- 8639 Sunny Ridge Dr
- 8630 Lake Crystal Dr
- 8626 Lake Crystal Dr
- 8651 Sunny Ridge Dr
- 8635 Sunny Ridge Dr
- 8634 Lake Crystal Dr
- 8622 Lake Crystal Dr
- 8638 Lake Crystal Dr
- 8646 Sunny Ridge Dr
- 8638 Sunny Ridge Dr
- 8627 Sunny Ridge Dr
- 8650 Sunny Ridge Dr
- 8618 Lake Crystal Dr
- 8634 Sunny Ridge Dr
- 8654 Sunny Ridge Dr
- 8623 Sunny Ridge Dr
- 8630 Sunny Ridge Dr
- 15719 Oak Mountain Dr
- 8631 Lake Crystal Dr