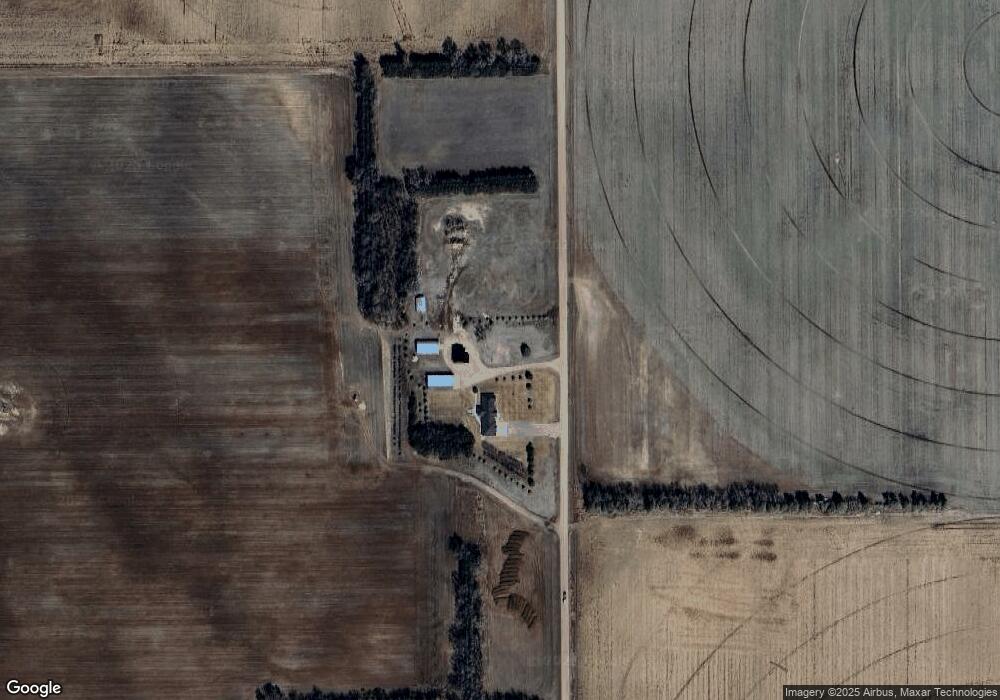
86459 530 Ave Plainview, NE 68769
Estimated Value: $126,000 - $594,756
--
Bed
--
Bath
2,308
Sq Ft
$156/Sq Ft
Est. Value
About This Home
This home is located at 86459 530 Ave, Plainview, NE 68769 and is currently estimated at $360,378, approximately $156 per square foot. 86459 530 Ave is a home located in Antelope County with nearby schools including Plainview Elementary School and Plainview Secondary School.
Ownership History
Date
Name
Owned For
Owner Type
Purchase Details
Closed on
Jul 14, 2018
Sold by
Aaron White
Bought by
May Mark E
Current Estimated Value
Home Financials for this Owner
Home Financials are based on the most recent Mortgage that was taken out on this home.
Original Mortgage
$230,000
Interest Rate
4.5%
Mortgage Type
New Conventional
Purchase Details
Closed on
Oct 16, 2017
Sold by
White Aaron
Bought by
May Mark E
Purchase Details
Closed on
Dec 16, 2006
Bought by
White Aaron and White Katherine
Create a Home Valuation Report for This Property
The Home Valuation Report is an in-depth analysis detailing your home's value as well as a comparison with similar homes in the area
Home Values in the Area
Average Home Value in this Area
Purchase History
| Date | Buyer | Sale Price | Title Company |
|---|---|---|---|
| May Mark E | -- | Attorney Only | |
| May Mark E | $85,000 | -- | |
| White Aaron | $45,000 | -- |
Source: Public Records
Mortgage History
| Date | Status | Borrower | Loan Amount |
|---|---|---|---|
| Previous Owner | May Mark E | $230,000 |
Source: Public Records
Tax History Compared to Growth
Tax History
| Year | Tax Paid | Tax Assessment Tax Assessment Total Assessment is a certain percentage of the fair market value that is determined by local assessors to be the total taxable value of land and additions on the property. | Land | Improvement |
|---|---|---|---|---|
| 2025 | $3,529 | $583,015 | $56,610 | $526,405 |
| 2024 | $3,529 | $526,950 | $56,610 | $470,340 |
| 2023 | $4,777 | $476,620 | $48,225 | $428,395 |
| 2022 | $4,821 | $440,840 | $43,225 | $397,615 |
| 2021 | $3,231 | $326,850 | $43,225 | $283,625 |
| 2020 | $3,115 | $322,295 | $43,225 | $279,070 |
| 2019 | $3,391 | $351,715 | $43,225 | $308,490 |
| 2018 | $921 | $98,510 | $43,225 | $55,285 |
| 2017 | $870 | $95,410 | $38,375 | $57,035 |
| 2016 | $960 | $107,335 | $39,075 | $68,260 |
| 2015 | $868 | $110,980 | $43,225 | $67,755 |
| 2014 | $854 | $95,315 | $26,610 | $68,705 |
Source: Public Records
Map
Nearby Homes