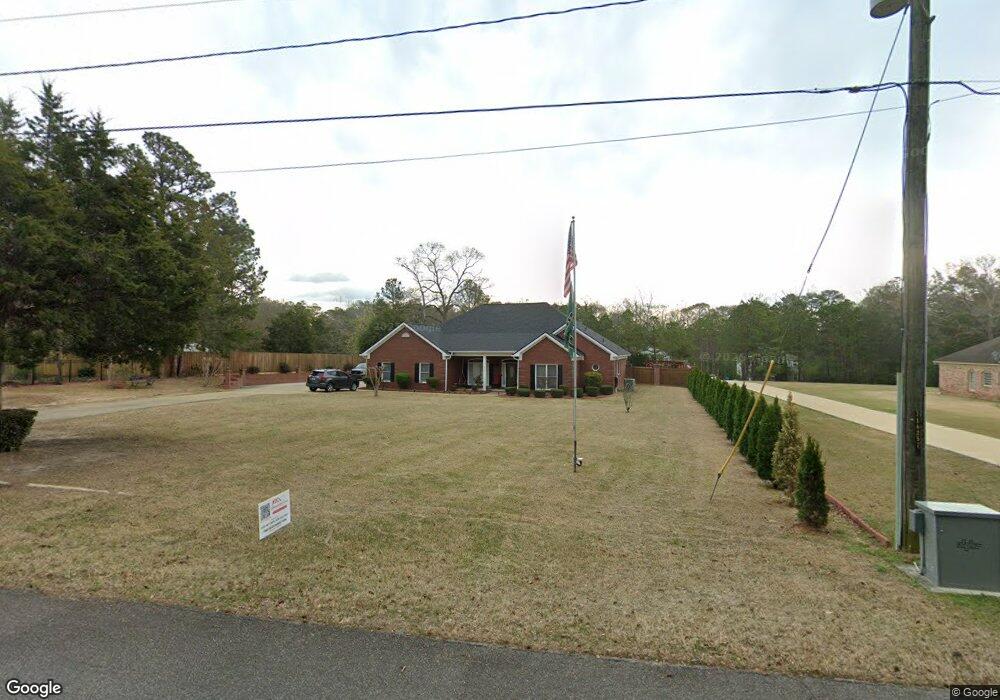
8646 Garrett Rd Midland, GA 31820
Midland NeighborhoodEstimated Value: $418,000 - $505,000
4
Beds
4
Baths
3,403
Sq Ft
$136/Sq Ft
Est. Value
About This Home
This home is located at 8646 Garrett Rd, Midland, GA 31820 and is currently estimated at $464,240, approximately $136 per square foot. 8646 Garrett Rd is a home located in Muscogee County with nearby schools including Mathews Elementary School, Aaron Cohn Middle School, and Shaw High School.
Ownership History
Date
Name
Owned For
Owner Type
Purchase Details
Closed on
Jun 15, 2018
Sold by
Wilmington Savings Fund Society Fsb Trus
Bought by
Campbell Altrus D and Campbell Sharon
Current Estimated Value
Home Financials for this Owner
Home Financials are based on the most recent Mortgage that was taken out on this home.
Original Mortgage
$270,000
Outstanding Balance
$234,027
Interest Rate
4.6%
Mortgage Type
VA
Estimated Equity
$230,213
Purchase Details
Closed on
Oct 3, 2017
Sold by
Brown Andra D
Bought by
Wilmington Savings Fund Societ
Purchase Details
Closed on
Mar 28, 2008
Sold by
Brown Andra D
Bought by
Brown Andra D and Brown Alfred
Home Financials for this Owner
Home Financials are based on the most recent Mortgage that was taken out on this home.
Original Mortgage
$292,600
Interest Rate
5.68%
Mortgage Type
Purchase Money Mortgage
Create a Home Valuation Report for This Property
The Home Valuation Report is an in-depth analysis detailing your home's value as well as a comparison with similar homes in the area
Home Values in the Area
Average Home Value in this Area
Purchase History
| Date | Buyer | Sale Price | Title Company |
|---|---|---|---|
| Campbell Altrus D | $280,000 | -- | |
| Wilmington Savings Fund Societ | $289,000 | -- | |
| Brown Andra D | -- | None Available | |
| Brown Andra D | $308,000 | None Available |
Source: Public Records
Mortgage History
| Date | Status | Borrower | Loan Amount |
|---|---|---|---|
| Open | Campbell Altrus D | $270,000 | |
| Previous Owner | Brown Andra D | $292,600 |
Source: Public Records
Tax History Compared to Growth
Tax History
| Year | Tax Paid | Tax Assessment Tax Assessment Total Assessment is a certain percentage of the fair market value that is determined by local assessors to be the total taxable value of land and additions on the property. | Land | Improvement |
|---|---|---|---|---|
| 2025 | $85 | $185,568 | $16,904 | $168,664 |
| 2024 | $85 | $169,900 | $16,904 | $152,996 |
| 2023 | $8 | $169,900 | $16,904 | $152,996 |
| 2022 | $621 | $139,156 | $16,904 | $122,252 |
| 2021 | $651 | $119,580 | $16,904 | $102,676 |
| 2020 | $1,019 | $119,580 | $16,904 | $102,676 |
| 2019 | $3,919 | $112,000 | $15,560 | $96,440 |
| 2018 | $4,248 | $121,396 | $16,904 | $104,492 |
| 2017 | $3,950 | $121,396 | $16,904 | $104,492 |
| 2016 | $3,968 | $125,747 | $22,080 | $103,667 |
| 2015 | $3,975 | $125,747 | $22,080 | $103,667 |
| 2014 | $3,981 | $125,747 | $22,080 | $103,667 |
| 2013 | -- | $125,747 | $22,080 | $103,667 |
Source: Public Records
Map
Nearby Homes
- 112 Ironwood Way Unit 83
- 112 Ironwood Way
- 8904 Lilly Rock Way
- 8848 Westwind Dr
- 1009 Crosswinds Dr
- 7101 Whitton Dr
- 1038 Crosswinds Dr
- 1049 Crosswinds Dr
- 1048 Crosswinds Dr
- 8599 Freedom Trail
- 8485 Liberty Hall Dr
- 7988 Westlake Dr
- 8016 Glen Valley Dr
- 7834 Oakhurst Ct
- 10176 Sable Ct
- 70 Meadow Valley Ct
- Lot 15 Oversee Ct
- 8615 Jackson Rd
- 10316 Emerson Way
- 51 Ironwood Ct
- 8620 Garrett Rd
- 9220 County Line Rd
- 9212 County Line Rd
- 8628 Garrett Rd
- 8624 Garrett Rd
- 118 Kristi Lynn's Ct
- 0 County Line Rd Unit 193601
- Lot 18 County Line Rd
- 11550 County Line Rd
- 0 County Line Rd Unit 8565657
- 0 County Line Rd Unit 8734714
- 0 County Line Rd Unit 8607648
- 0 County Line Rd
- 8601 Garrett Rd
- 8595 Garrett Rd
- 9060 County Line Rd
- 8600 Garrett Rd
- 9040 County Line Rd
- 8505 Garrett Rd
- 8465 Garrett Rd