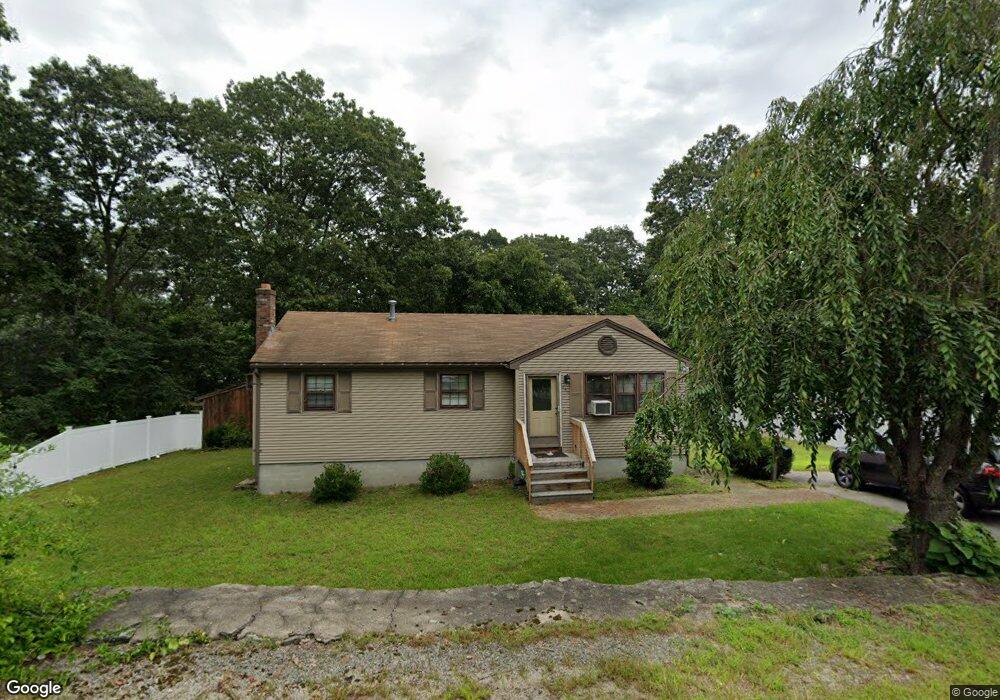
865 3rd Ave Woonsocket, RI 02895
Fairmount NeighborhoodEstimated Value: $360,000 - $394,000
2
Beds
1
Bath
1,740
Sq Ft
$214/Sq Ft
Est. Value
About This Home
This home is located at 865 3rd Ave, Woonsocket, RI 02895 and is currently estimated at $373,039, approximately $214 per square foot. 865 3rd Ave is a home located in Providence County with nearby schools including Woonsocket High School, Rise Prep Mayoral Academy Middle School, and Rise Prep Mayoral Academy.
Ownership History
Date
Name
Owned For
Owner Type
Purchase Details
Closed on
Dec 6, 1999
Sold by
Gmac Mtg Corp
Bought by
Secretary Veterans
Current Estimated Value
Home Financials for this Owner
Home Financials are based on the most recent Mortgage that was taken out on this home.
Original Mortgage
$113,850
Outstanding Balance
$35,560
Interest Rate
7.83%
Estimated Equity
$337,479
Purchase Details
Closed on
May 1, 1996
Sold by
Fontaine Geraldine L
Bought by
Brizard William J and Brizard Janet
Home Financials for this Owner
Home Financials are based on the most recent Mortgage that was taken out on this home.
Original Mortgage
$107,100
Interest Rate
7.82%
Mortgage Type
Purchase Money Mortgage
Create a Home Valuation Report for This Property
The Home Valuation Report is an in-depth analysis detailing your home's value as well as a comparison with similar homes in the area
Home Values in the Area
Average Home Value in this Area
Purchase History
| Date | Buyer | Sale Price | Title Company |
|---|---|---|---|
| Secretary Veterans | $95,500 | -- | |
| Brizard William J | $110,000 | -- | |
| Secretary Veterans | $95,500 | -- | |
| Brizard William J | $110,000 | -- |
Source: Public Records
Mortgage History
| Date | Status | Borrower | Loan Amount |
|---|---|---|---|
| Open | Brizard William J | $113,850 | |
| Previous Owner | Brizard William J | $107,100 |
Source: Public Records
Tax History
| Year | Tax Paid | Tax Assessment Tax Assessment Total Assessment is a certain percentage of the fair market value that is determined by local assessors to be the total taxable value of land and additions on the property. | Land | Improvement |
|---|---|---|---|---|
| 2025 | $3,935 | $350,400 | $109,900 | $240,500 |
| 2024 | $3,456 | $237,700 | $97,500 | $140,200 |
| 2023 | $3,323 | $237,700 | $97,500 | $140,200 |
| 2022 | $3,323 | $237,700 | $97,500 | $140,200 |
| 2021 | $3,793 | $159,700 | $64,100 | $95,600 |
| 2020 | $3,833 | $159,700 | $64,100 | $95,600 |
| 2018 | $3,846 | $159,700 | $64,100 | $95,600 |
| 2017 | $3,832 | $127,300 | $47,900 | $79,400 |
| 2016 | $4,053 | $127,300 | $47,900 | $79,400 |
| 2015 | $4,836 | $132,200 | $47,900 | $84,300 |
| 2014 | $3,182 | $126,500 | $52,700 | $73,800 |
Source: Public Records
Map
Nearby Homes
Your Personal Tour Guide
Ask me questions while you tour the home.