Estimated Value: $125,000 - $190,000
2
Beds
1
Bath
1,205
Sq Ft
$135/Sq Ft
Est. Value
About This Home
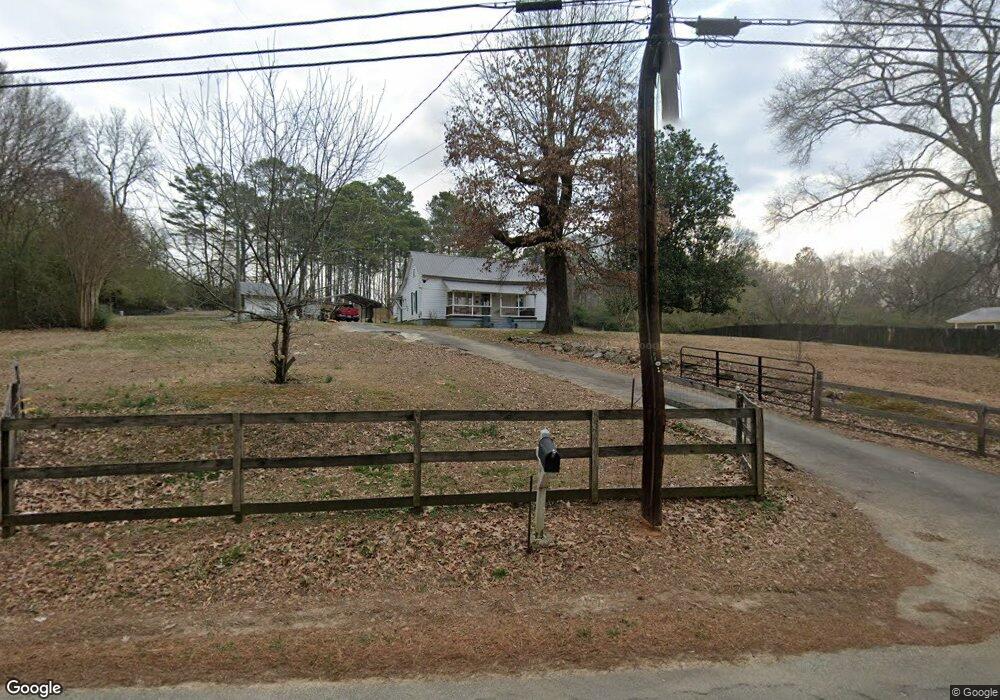
This home is located at 865 Barker Rd SW, Rome, GA 30165 and is currently estimated at $162,158, approximately $134 per square foot. 865 Barker Rd SW is a home located in Floyd County with nearby schools including Coosa Middle School and Coosa High School.
Ownership History
Date
Name
Owned For
Owner Type
Purchase Details
Closed on
Jul 25, 2008
Sold by
Not Provided
Bought by
Turner Kathy and Turner Tony L
Current Estimated Value
Home Financials for this Owner
Home Financials are based on the most recent Mortgage that was taken out on this home.
Original Mortgage
$42,000
Outstanding Balance
$27,586
Interest Rate
6.43%
Mortgage Type
New Conventional
Estimated Equity
$134,572
Purchase Details
Closed on
Aug 20, 2002
Sold by
Gilmore Jackie L and Gilmore Judy D
Bought by
Gilmore Judy D and Judy Rogers 1
Purchase Details
Closed on
Aug 15, 2001
Bought by
P and R
Purchase Details
Closed on
May 30, 2000
Sold by
Norman Ida
Bought by
Gilmore Jackie L and Gilmore Judy D
Purchase Details
Closed on
Jan 1, 1947
Sold by
Mrs H P Norman
Bought by
Norman Ida
Purchase Details
Closed on
Jan 1, 1901
Bought by
Mrs H P Norman
Create a Home Valuation Report for This Property
The Home Valuation Report is an in-depth analysis detailing your home's value as well as a comparison with similar homes in the area
Home Values in the Area
Average Home Value in this Area
Purchase History
| Date | Buyer | Sale Price | Title Company |
|---|---|---|---|
| Turner Kathy | -- | -- | |
| Turner Kathy | $48,000 | -- | |
| Turner Kathy | -- | -- | |
| Turner Kathy | $48,000 | -- | |
| Gilmore Judy D | -- | -- | |
| P | -- | -- | |
| Gilmore Jackie L | $38,000 | -- | |
| Norman Ida | -- | -- | |
| Mrs H P Norman | -- | -- |
Source: Public Records
Mortgage History
| Date | Status | Borrower | Loan Amount |
|---|---|---|---|
| Open | Turner Kathy | $42,000 | |
| Closed | Turner Kathy | $42,000 |
Source: Public Records
Tax History Compared to Growth
Tax History
| Year | Tax Paid | Tax Assessment Tax Assessment Total Assessment is a certain percentage of the fair market value that is determined by local assessors to be the total taxable value of land and additions on the property. | Land | Improvement |
|---|---|---|---|---|
| 2024 | $1,170 | $36,834 | $19,304 | $17,530 |
| 2023 | $1,054 | $34,468 | $17,549 | $16,919 |
| 2022 | $805 | $27,147 | $14,514 | $12,633 |
| 2021 | $709 | $23,476 | $13,206 | $10,270 |
| 2020 | $645 | $21,182 | $11,484 | $9,698 |
| 2019 | $619 | $20,599 | $11,484 | $9,115 |
| 2018 | $581 | $19,314 | $10,937 | $8,377 |
| 2017 | $548 | $18,171 | $10,127 | $8,044 |
| 2016 | $553 | $18,132 | $10,120 | $8,012 |
| 2015 | $541 | $18,132 | $10,120 | $8,012 |
| 2014 | $541 | $18,132 | $10,120 | $8,012 |
Source: Public Records
Map
Nearby Homes
- 876 Barker Rd SW
- 973 Barker Rd SW
- 89 Barker Rd SW
- 0 Barker Rd SW Unit 10651788
- 0 Barker Rd SW Unit LotWP001
- 48 Highlander Trail SW
- 83 Manning Lake Rd SW
- 14 Bryan Springs Rd SW
- 87 Northside Dr NW
- 125 Thornwood Dr SW
- 1 Willowrun Dr SW
- 10 Bush Arbor Place SW
- 120 Thornwood Dr SW
- 8 Bush Arbor Place SW
- The Foxcroft Plan at North Haven
- The McGinnis Plan at North Haven
- The Caldwell Plan at North Haven
- The Bradley Plan at North Haven
- The Pearson Plan at North Haven
- The Coleman Plan at North Haven
- 877 Barker Rd SW
- 904 Barker Rd SW
- 846 Barker Rd SW
- 899 Barker Rd SW
- 890 Barker Rd SW
- 837 Barker Rd SW
- 836 Barker Rd SW
- 951 Barker Rd SW
- 834 Barker Rd SW
- 961 Barker Rd SW
- 900 Barker Rd SW
- 960 Barker Rd SW
- 916 Barker Rd SW
- 912 Barker Rd SW
- 774 Barker Rd SW
- 986 Barker Rd SW
- 910 Barker Rd SW
- 993 Barker Rd SW
- 735 Barker Rd SW
- 1020 Barker Rd SW