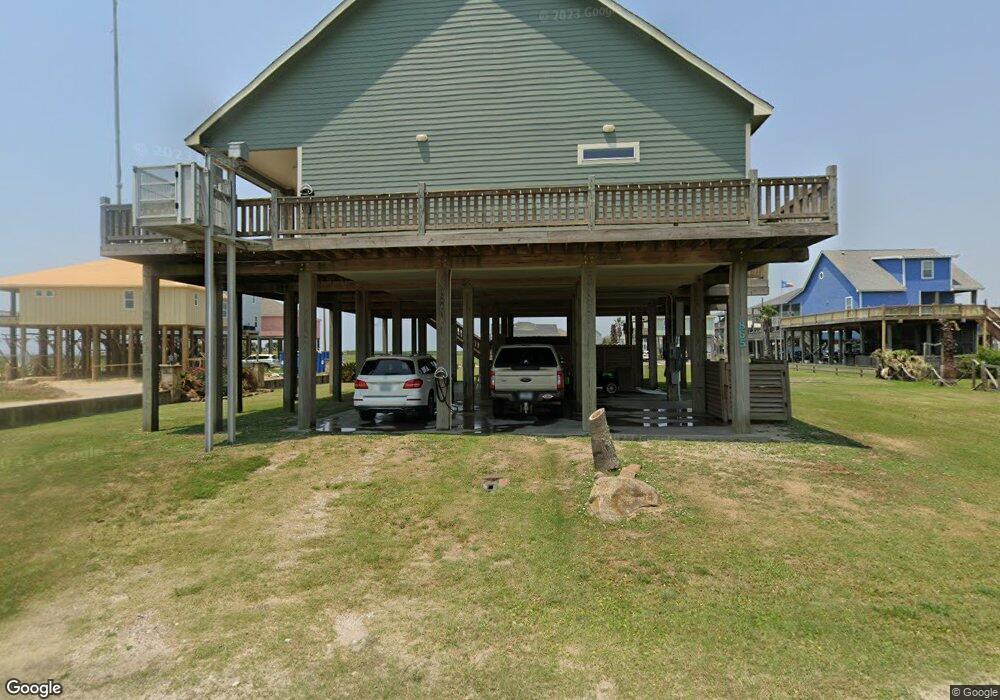
865 Bowers Ln Unit 10 & 15 Crystal Beach, TX 77650
Crystal Beach NeighborhoodEstimated Value: $765,000 - $1,070,000
2
Beds
--
Bath
3,100
Sq Ft
$287/Sq Ft
Est. Value
About This Home
This home is located at 865 Bowers Ln Unit 10 & 15, Crystal Beach, TX 77650 and is currently estimated at $889,591, approximately $286 per square foot. 865 Bowers Ln Unit 10 & 15 is a home located in Galveston County with nearby schools including Morgan Elementary Magnet School, Burnet STREAM Magnet School, and Parker Elementary School.
Ownership History
Date
Name
Owned For
Owner Type
Purchase Details
Closed on
Apr 18, 2018
Sold by
Weisinger Wesley Craig and Weisinger Debra Ann
Bought by
Weisinger Wesley Craig and Weisinger Debra Ann
Current Estimated Value
Home Financials for this Owner
Home Financials are based on the most recent Mortgage that was taken out on this home.
Original Mortgage
$550,000
Outstanding Balance
$473,210
Interest Rate
4.46%
Mortgage Type
Purchase Money Mortgage
Estimated Equity
$416,381
Purchase Details
Closed on
Jun 17, 2015
Sold by
Weisinger Wesley Craig and Weisinger Debra Ann
Bought by
Oyster Family Trust
Purchase Details
Closed on
Jun 24, 2011
Sold by
Steitler Susan M and Rogers Joel K
Bought by
Weisinger Wesley C and Weisinger Debra Ann
Purchase Details
Closed on
Apr 16, 1999
Sold by
Bowers Lucille E and Daniel Lucille E
Bought by
Rogers Susan M Steitler and Rogers Joel K
Create a Home Valuation Report for This Property
The Home Valuation Report is an in-depth analysis detailing your home's value as well as a comparison with similar homes in the area
Home Values in the Area
Average Home Value in this Area
Purchase History
| Date | Buyer | Sale Price | Title Company |
|---|---|---|---|
| Weisinger Wesley Craig | -- | South Land Title Llc | |
| Oyster Family Trust | -- | None Available | |
| Weisinger Wesley C | -- | South Land Title Llc | |
| Rogers Susan M Steitler | -- | South Land Title Company |
Source: Public Records
Mortgage History
| Date | Status | Borrower | Loan Amount |
|---|---|---|---|
| Open | Weisinger Wesley Craig | $550,000 |
Source: Public Records
Tax History Compared to Growth
Tax History
| Year | Tax Paid | Tax Assessment Tax Assessment Total Assessment is a certain percentage of the fair market value that is determined by local assessors to be the total taxable value of land and additions on the property. | Land | Improvement |
|---|---|---|---|---|
| 2025 | $4,533 | $795,130 | $237,520 | $557,610 |
| 2024 | $4,533 | $777,280 | -- | -- |
| 2023 | $4,533 | $706,618 | $0 | $0 |
| 2022 | $10,351 | $642,380 | $0 | $0 |
| 2021 | $10,187 | $658,810 | $80,720 | $578,090 |
| 2020 | $9,854 | $559,180 | $80,720 | $478,460 |
| 2019 | $9,391 | $482,630 | $80,720 | $401,910 |
| 2018 | $9,445 | $482,630 | $80,720 | $401,910 |
| 2017 | $9,441 | $482,630 | $80,720 | $401,910 |
| 2016 | $9,441 | $482,620 | $80,720 | $401,900 |
| 2015 | $6,974 | $482,620 | $80,720 | $401,900 |
| 2014 | -- | $80,720 | $80,720 | $0 |
Source: Public Records
Map
Nearby Homes
- 865 Bowers Ln
- Lot 47 Bowers Ln
- 15 Bowers
- 864-867 Bowers Unit 18 & 23
- 864-867 Bowers
- TBD Noisy Waves
- 864 Bowers Ln Unit 867
- 864 Bowers Ln
- 0 Bowers Unit 9991918
- 2168 Noisy Waves St
- 2168 Noisy Waves St
- 2168 Noisy Waves St Unit 3
- LOT 46 Bowers Ln
- 862 Bowers Ln
- 2178 Noisy Waves St
- 2170 Noisy Waves
- 2170 Noisy Waves Unit 3-4
- 876 Bowers Ln
- 867 Meynig Dr
- 2174 Noisy Waves Unit 4