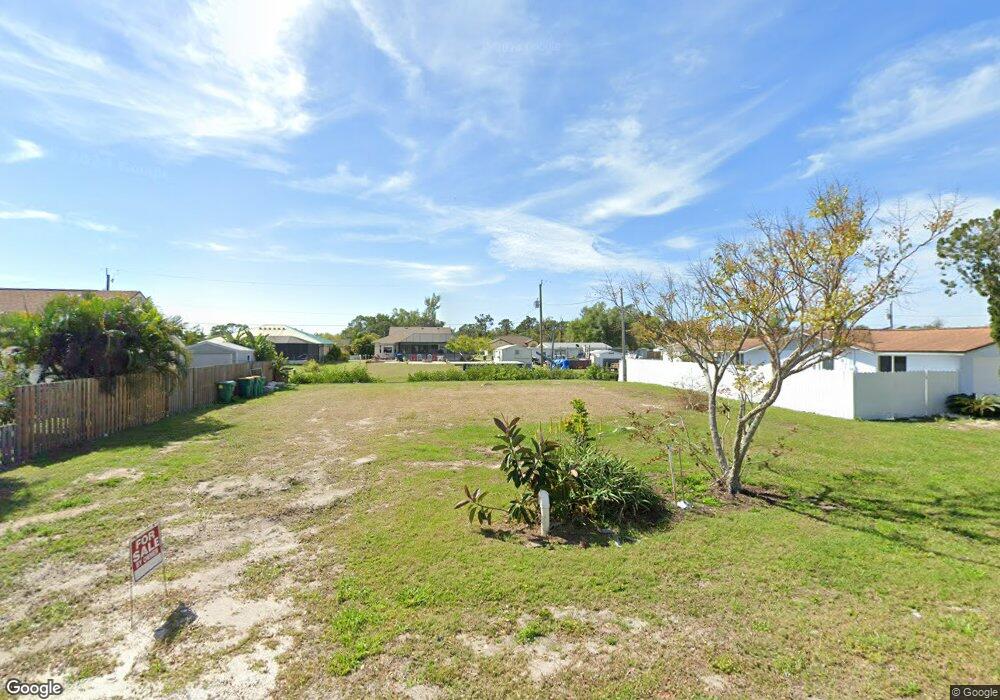
865 E 3rd St Englewood, FL 34223
Englewood South NeighborhoodEstimated Value: $87,000 - $418,000
2
Beds
1
Bath
968
Sq Ft
$279/Sq Ft
Est. Value
About This Home
This home is located at 865 E 3rd St, Englewood, FL 34223 and is currently estimated at $270,005, approximately $278 per square foot. 865 E 3rd St is a home located in Charlotte County with nearby schools including Myakka River Elementary School, L.A. Ainger Middle School, and Lemon Bay High School.
Ownership History
Date
Name
Owned For
Owner Type
Purchase Details
Closed on
Apr 26, 2023
Sold by
Nu Holdings Llc
Bought by
Lacaria Sam and Lacaria Salvatore
Current Estimated Value
Purchase Details
Closed on
Mar 24, 2022
Sold by
865 Snowshoe Llc
Bought by
Nu Holdings Llc
Purchase Details
Closed on
Dec 13, 2012
Sold by
Chin Yee Stephen A and Chin Yee Kelly A
Bought by
865 Snowshoe Llc
Purchase Details
Closed on
Aug 30, 2001
Sold by
Holmes Russell B and Holmes Dorothy M J
Bought by
Chin Yee Stephen A Chin and Chin Lee Kelly A
Home Financials for this Owner
Home Financials are based on the most recent Mortgage that was taken out on this home.
Original Mortgage
$56,000
Interest Rate
6.98%
Create a Home Valuation Report for This Property
The Home Valuation Report is an in-depth analysis detailing your home's value as well as a comparison with similar homes in the area
Home Values in the Area
Average Home Value in this Area
Purchase History
| Date | Buyer | Sale Price | Title Company |
|---|---|---|---|
| Lacaria Sam | $100 | None Listed On Document | |
| Nu Holdings Llc | $330,000 | Dunlap & Moran Pa | |
| 865 Snowshoe Llc | -- | Attorney | |
| Chin Yee Stephen A Chin | $70,000 | -- |
Source: Public Records
Mortgage History
| Date | Status | Borrower | Loan Amount |
|---|---|---|---|
| Previous Owner | Chin Yee Stephen A Chin | $56,000 |
Source: Public Records
Tax History
| Year | Tax Paid | Tax Assessment Tax Assessment Total Assessment is a certain percentage of the fair market value that is determined by local assessors to be the total taxable value of land and additions on the property. | Land | Improvement |
|---|---|---|---|---|
| 2025 | $2,116 | $92,045 | $92,045 | -- |
| 2024 | $2,517 | $118,157 | $118,157 | -- |
| 2023 | $2,517 | $111,578 | $110,976 | $602 |
| 2022 | $3,368 | $223,417 | $84,864 | $138,553 |
| 2021 | $2,597 | $114,945 | $48,307 | $66,638 |
| 2020 | $2,520 | $110,777 | $50,592 | $60,185 |
| 2019 | $2,463 | $110,018 | $50,592 | $59,426 |
| 2018 | $2,265 | $106,378 | $45,043 | $61,335 |
| 2017 | $2,194 | $100,841 | $45,043 | $55,798 |
| 2016 | $2,018 | $96,267 | $0 | $0 |
| 2015 | $1,903 | $89,649 | $0 | $0 |
| 2014 | $1,770 | $82,402 | $0 | $0 |
Source: Public Records
Map
Nearby Homes
Your Personal Tour Guide
Ask me questions while you tour the home.