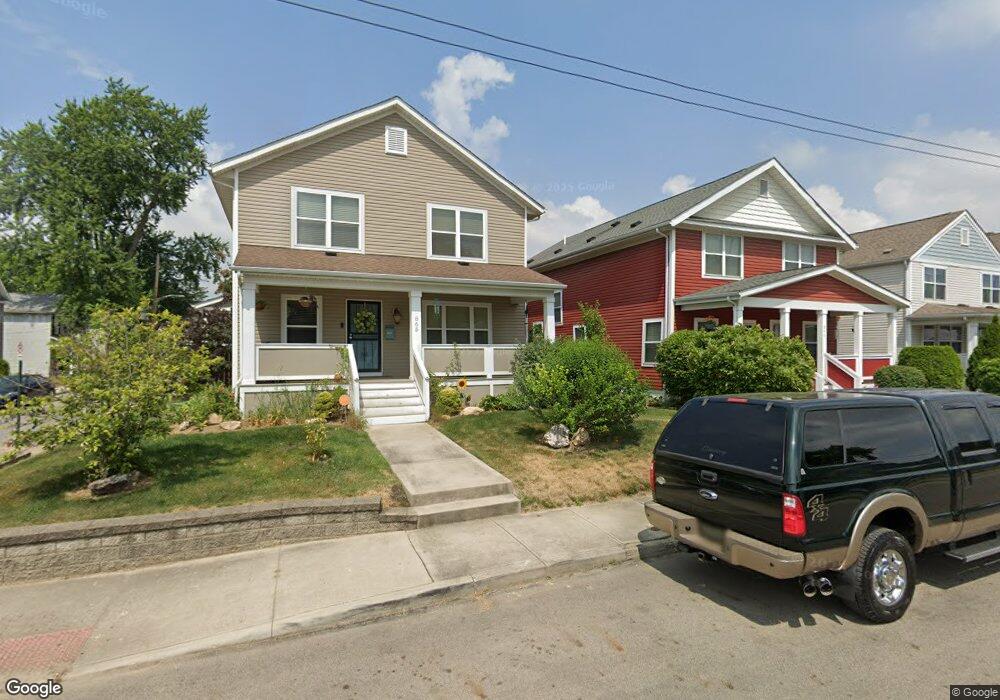
865 S 18th St Unit 867 Columbus, OH 43206
Southern Orchards NeighborhoodEstimated Value: $371,000 - $428,000
4
Beds
4
Baths
2,680
Sq Ft
$150/Sq Ft
Est. Value
About This Home
This home is located at 865 S 18th St Unit 867, Columbus, OH 43206 and is currently estimated at $401,003, approximately $149 per square foot. 865 S 18th St Unit 867 is a home located in Franklin County with nearby schools including Livingston Elementary School, South High School, and South Columbus Preparatory Academy.
Ownership History
Date
Name
Owned For
Owner Type
Purchase Details
Closed on
Dec 12, 2011
Sold by
Hnhf Realty Collaborative
Bought by
Garvin Johnny C
Current Estimated Value
Home Financials for this Owner
Home Financials are based on the most recent Mortgage that was taken out on this home.
Original Mortgage
$111,100
Outstanding Balance
$77,408
Interest Rate
4.4%
Mortgage Type
FHA
Estimated Equity
$323,595
Purchase Details
Closed on
Aug 25, 2009
Sold by
Yee Wilming F
Bought by
Hnhf Realty Collaborative
Purchase Details
Closed on
May 9, 2002
Sold by
Firstar Bank Milwaukee Na
Bought by
Yee Wilming F
Purchase Details
Closed on
Aug 1, 2001
Sold by
Tate Davie and Case #00Cve07 6236
Bought by
Firstar Bank Milwaukee Na and New Century Home Equity Loan Trust
Purchase Details
Closed on
Mar 31, 1999
Sold by
Tribb Corp
Bought by
Tate Davis
Purchase Details
Closed on
Mar 6, 1998
Sold by
Columbus Metropolitan Housing Authority
Bought by
Johnson John V and Johnson Sheril E
Create a Home Valuation Report for This Property
The Home Valuation Report is an in-depth analysis detailing your home's value as well as a comparison with similar homes in the area
Home Values in the Area
Average Home Value in this Area
Purchase History
| Date | Buyer | Sale Price | Title Company |
|---|---|---|---|
| Garvin Johnny C | $129,000 | Attorney | |
| Hnhf Realty Collaborative | $22,500 | Attorney | |
| Yee Wilming F | $40,000 | Amerititle Mill Run | |
| Firstar Bank Milwaukee Na | $40,551 | -- | |
| Tate Davis | $130,000 | -- | |
| Tribb Corp | $44,900 | -- | |
| Johnson John V | -- | Title First Agency |
Source: Public Records
Mortgage History
| Date | Status | Borrower | Loan Amount |
|---|---|---|---|
| Open | Garvin Johnny C | $111,100 |
Source: Public Records
Tax History Compared to Growth
Tax History
| Year | Tax Paid | Tax Assessment Tax Assessment Total Assessment is a certain percentage of the fair market value that is determined by local assessors to be the total taxable value of land and additions on the property. | Land | Improvement |
|---|---|---|---|---|
| 2024 | $4,215 | $93,910 | $31,260 | $62,650 |
| 2023 | $4,161 | $93,910 | $31,260 | $62,650 |
| 2022 | $3,050 | $58,800 | $7,140 | $51,660 |
| 2021 | $948 | $58,810 | $7,140 | $51,670 |
| 2020 | $949 | $58,810 | $7,140 | $51,670 |
| 2019 | $852 | $45,230 | $5,500 | $39,730 |
| 2018 | $804 | $45,230 | $5,500 | $39,730 |
| 2017 | $851 | $45,230 | $5,500 | $39,730 |
| 2016 | $835 | $45,150 | $3,710 | $41,440 |
| 2015 | $758 | $45,150 | $3,710 | $41,440 |
| 2014 | $760 | $45,150 | $3,710 | $41,440 |
| 2013 | $375 | $12,600 | $3,710 | $8,890 |
Source: Public Records
Map
Nearby Homes
- 792 S 18th St
- 667 E Columbus St
- 901 Heyl Ave
- 786 Ann St
- 863 Carpenter St
- 841 Ann St
- 644 Stanley Ave
- 954 S 18th St
- 958 S 18th St
- 1095 E Sycamore St
- 800 Carpenter St
- 977 Heyl Ave
- 575 E Columbus St Unit 577
- 975 Carpenter St
- 785 Gilbert St
- 596 E Whittier St
- 981 Gilbert St
- 556 Stanley Ave
- 887-891 S 22nd St
- 867 S 22nd St
- 859 S 18th St
- 875 S 18th St
- 853 S 18th St
- 0 S 18th St
- 709 E Columbus St
- 881 S 18th St
- 847 S 18th St
- 701 E Columbus St
- 858 S 17th St
- 852 S 17th St
- 887 S 18th St
- 693 E Columbus St
- 848 S 17th St
- 843 S 18th St
- 886 S 18th St
- 882 S 18th St
- 842 S 17th St
- 687 E Columbus St Unit 689
- 835-837 S 18th St
- 835 S 18th St Unit 837