Estimated Value: $472,000 - $516,000
3
Beds
2
Baths
1,450
Sq Ft
$338/Sq Ft
Est. Value
About This Home
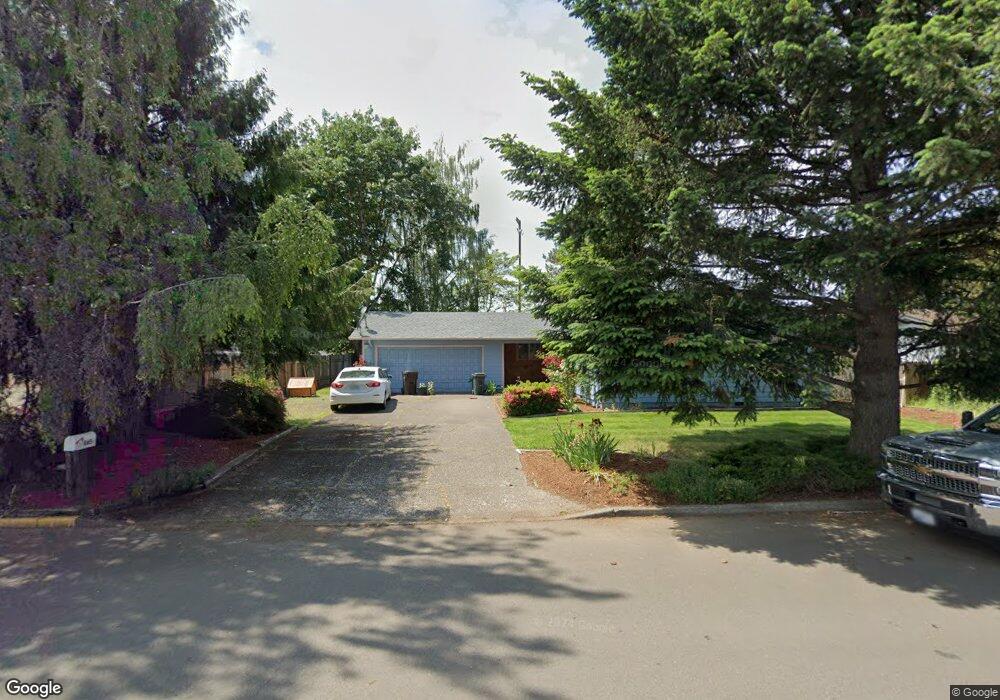
This home is located at 865 S Douglas St, Canby, OR 97013 and is currently estimated at $489,787, approximately $337 per square foot. 865 S Douglas St is a home located in Clackamas County with nearby schools including Josefa L. Sambrano Elementary School, Philander Lee Elementary School, and Baker Prairie Middle School.
Ownership History
Date
Name
Owned For
Owner Type
Purchase Details
Closed on
Nov 25, 2024
Sold by
Jimenez Jose Luis and Jimenez Josefina Hernandez
Bought by
Jimenez Jose Luis and Jimenez Josefina Hernandez
Current Estimated Value
Home Financials for this Owner
Home Financials are based on the most recent Mortgage that was taken out on this home.
Original Mortgage
$175,000
Outstanding Balance
$173,191
Interest Rate
6.44%
Mortgage Type
New Conventional
Estimated Equity
$316,596
Purchase Details
Closed on
Dec 4, 2018
Sold by
Hernandez Jimenez Jose Luis and Hernandez Jimenez Josefina
Bought by
Hernandez Jimenez Jose Luis and Hernandez Jimenez Josefina
Purchase Details
Closed on
Jul 13, 1995
Sold by
Shelton Shirley R
Bought by
Jimenez Jose Luis and Jimenez Josefina Hernandez
Home Financials for this Owner
Home Financials are based on the most recent Mortgage that was taken out on this home.
Original Mortgage
$104,850
Interest Rate
7.74%
Create a Home Valuation Report for This Property
The Home Valuation Report is an in-depth analysis detailing your home's value as well as a comparison with similar homes in the area
Home Values in the Area
Average Home Value in this Area
Purchase History
| Date | Buyer | Sale Price | Title Company |
|---|---|---|---|
| Jimenez Jose Luis | -- | Fidelity National Title | |
| Hernandez Jimenez Jose Luis | -- | Lawyers Title | |
| Jimenez Jose Luis | $116,500 | Stewart Title |
Source: Public Records
Mortgage History
| Date | Status | Borrower | Loan Amount |
|---|---|---|---|
| Open | Jimenez Jose Luis | $175,000 | |
| Previous Owner | Jimenez Jose Luis | $104,850 |
Source: Public Records
Tax History Compared to Growth
Tax History
| Year | Tax Paid | Tax Assessment Tax Assessment Total Assessment is a certain percentage of the fair market value that is determined by local assessors to be the total taxable value of land and additions on the property. | Land | Improvement |
|---|---|---|---|---|
| 2025 | $4,671 | $263,628 | -- | -- |
| 2024 | $4,540 | $255,950 | -- | -- |
| 2023 | $4,540 | $248,496 | $0 | $0 |
| 2022 | $4,176 | $241,259 | $0 | $0 |
| 2021 | $4,021 | $234,233 | $0 | $0 |
| 2020 | $3,949 | $227,411 | $0 | $0 |
| 2019 | $3,760 | $220,788 | $0 | $0 |
| 2018 | $3,677 | $214,357 | $0 | $0 |
| 2017 | $3,583 | $208,114 | $0 | $0 |
| 2016 | $3,464 | $202,052 | $0 | $0 |
| 2015 | $3,345 | $196,167 | $0 | $0 |
| 2014 | $3,249 | $190,453 | $0 | $0 |
Source: Public Records
Map
Nearby Homes
- 1339 S Baywood Ct
- 431 SW 3rd Ave
- 1198 SW 1st Ave
- 1491 S Fir St Unit 18
- 1487 S Fir St Unit Lot17
- 1485 S Fir St Unit Lot 16
- 1400 S Elm St Unit 91
- 481 S Holly St
- 299 SW 3rd Ave
- 476 SW 15th Ave
- 442 SW 15th Ave Unit 15
- 448 SW 15th Ave Unit 14
- 452 SW 15th Ave Unit 13
- 1655 S Elm St Unit 2
- 1655 S Elm St
- 1655 S Elm St Unit 302
- 574 S Ivy St
- 916 NW 2nd Ave
- 812 NW 3rd Ave
- 850 NW 3rd Ave
- 815 S Douglas St
- 765 S Douglas St
- 955 S Douglas St
- 870 S Douglas St
- 820 S Douglas St
- 570 SW 10th Ave
- 729 S Douglas St
- 995 S Douglas St
- 770 S Douglas St
- 595 SW 10th Ave
- 575 SW 10th Ave
- 730 S Douglas St
- 875 S Elm St
- 835 S Elm St
- 520 SW 10th Ave
- 785 S Elm St
- 545 SW 10th Ave
- 690 S Douglas St
- 681 S Douglas St
- 731 S Elm St