865 Schomer Rd Unit 6 Aurora, IL 60505
Indian Creek NeighborhoodEstimated Value: $387,000 - $487,000
3
Beds
4
Baths
2,101
Sq Ft
$202/Sq Ft
Est. Value
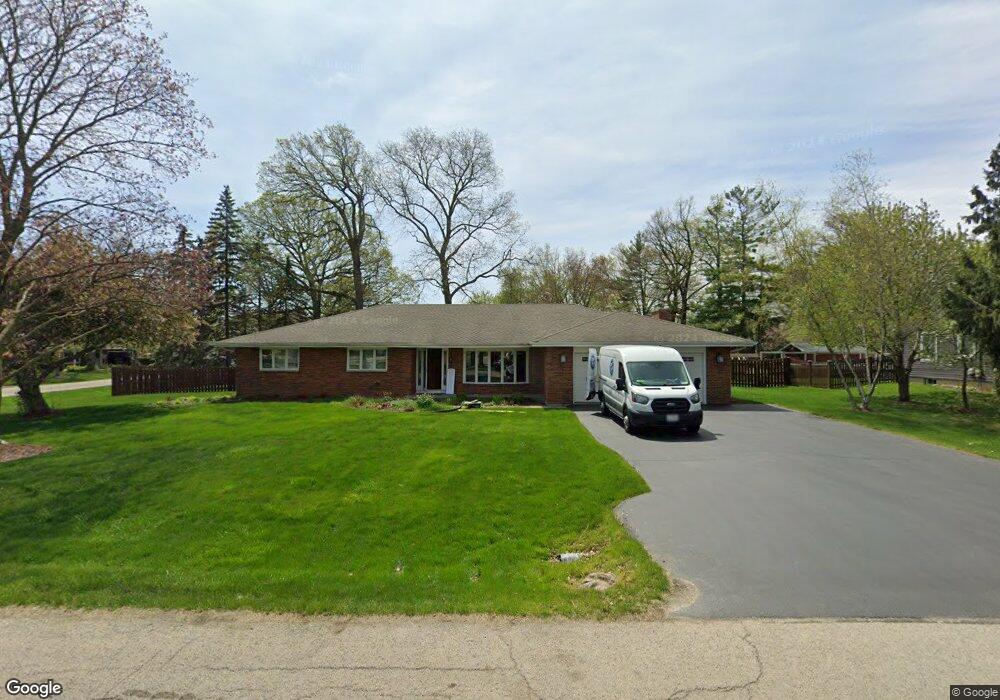
About This Home
This home is located at 865 Schomer Rd Unit 6, Aurora, IL 60505 and is currently estimated at $424,431, approximately $202 per square foot. 865 Schomer Rd Unit 6 is a home located in Kane County with nearby schools including Nicholas A Hermes Elementary School, Simmons Middle School, and East Aurora High School.
Ownership History
Date
Name
Owned For
Owner Type
Purchase Details
Closed on
Jul 9, 2020
Sold by
Lampert Paula S
Bought by
Schuler Lampert Paula and Schuler Paula Lampert
Current Estimated Value
Purchase Details
Closed on
Nov 14, 2016
Sold by
Lampert Mark N
Bought by
Lampert Paula M
Purchase Details
Closed on
Oct 13, 2000
Sold by
Roscoe Scott D and Roscoe Lisa A
Bought by
Lampert Mark N and Lampert Paula S
Home Financials for this Owner
Home Financials are based on the most recent Mortgage that was taken out on this home.
Original Mortgage
$142,000
Outstanding Balance
$51,934
Interest Rate
7.96%
Estimated Equity
$372,497
Purchase Details
Closed on
Aug 4, 1995
Sold by
Hermes Donna M
Bought by
Droscoe Scott A and Roscoe Lisa
Home Financials for this Owner
Home Financials are based on the most recent Mortgage that was taken out on this home.
Original Mortgage
$105,000
Interest Rate
7.51%
Create a Home Valuation Report for This Property
The Home Valuation Report is an in-depth analysis detailing your home's value as well as a comparison with similar homes in the area
Home Values in the Area
Average Home Value in this Area
Purchase History
| Date | Buyer | Sale Price | Title Company |
|---|---|---|---|
| Schuler Lampert Paula | -- | None Available | |
| Lampert Paula M | -- | None Available | |
| Lampert Mark N | $179,000 | Chicago Title Insurance Co | |
| Droscoe Scott A | $140,000 | Chicago Title Insurance Co |
Source: Public Records
Mortgage History
| Date | Status | Borrower | Loan Amount |
|---|---|---|---|
| Open | Lampert Mark N | $142,000 | |
| Previous Owner | Droscoe Scott A | $105,000 | |
| Closed | Lampert Mark N | $11,200 |
Source: Public Records
Tax History Compared to Growth
Tax History
| Year | Tax Paid | Tax Assessment Tax Assessment Total Assessment is a certain percentage of the fair market value that is determined by local assessors to be the total taxable value of land and additions on the property. | Land | Improvement |
|---|---|---|---|---|
| 2024 | $7,891 | $128,458 | $21,211 | $107,247 |
| 2023 | $5,908 | $114,777 | $18,952 | $95,825 |
| 2022 | $5,518 | $104,724 | $17,292 | $87,432 |
| 2021 | $5,133 | $91,658 | $16,099 | $75,559 |
| 2020 | $5,232 | $90,692 | $14,954 | $75,738 |
| 2019 | $5,173 | $84,028 | $13,855 | $70,173 |
| 2018 | $5,113 | $79,455 | $12,816 | $66,639 |
| 2017 | $5,433 | $77,583 | $11,809 | $65,774 |
| 2016 | $5,437 | $71,660 | $10,123 | $61,537 |
| 2015 | -- | $69,779 | $8,705 | $61,074 |
| 2014 | -- | $58,328 | $9,419 | $48,909 |
| 2013 | -- | $69,968 | $9,284 | $60,684 |
Source: Public Records
Map
Nearby Homes
- 745 Donna Ave
- 1521 Saddle Ln
- 1750 N Marywood Ave Unit 603
- 1716 N Marywood Ave
- 1826 N Farnsworth Ave
- 1215 Constellation Dr
- 1220 Comet Dr
- 451 Turner Rd
- 1953 Charles Ln Unit 1953
- 1942 Tall Oaks Dr Unit 1A
- 1220 Mitchell Rd
- 1419 Mcclure Rd Unit 1419
- 1855 Tall Oaks Dr Unit 3303
- 961 Trask St
- 0000 N Farnsworth Ave
- 1616 Colchester Ln
- 3 Lovedale Ln
- 1655 Felten Rd
- 2856 Church Rd
- 218 Forest Ave
- 885 Schomer Rd
- 855 Schomer Rd
- 1904 Margaret Ct
- 895 Schomer Rd
- 1907 Schomer Ct
- 890 Schomer Rd
- 1908 Margaret Ct
- 831 Schomer Rd
- 830 Konen Ave Unit 9
- 1911 Schomer Ct
- 1912 Margaret Ct
- 1915 Schomer Ct
- 905 Schomer Rd
- 820 Konen Ave
- 900 Schomer Rd
- 1901 Margaret Ct
- 1916 Margaret Ct
- 1902 Schomer Ct
- 1919 Schomer Ct
- 821 Schomer Rd