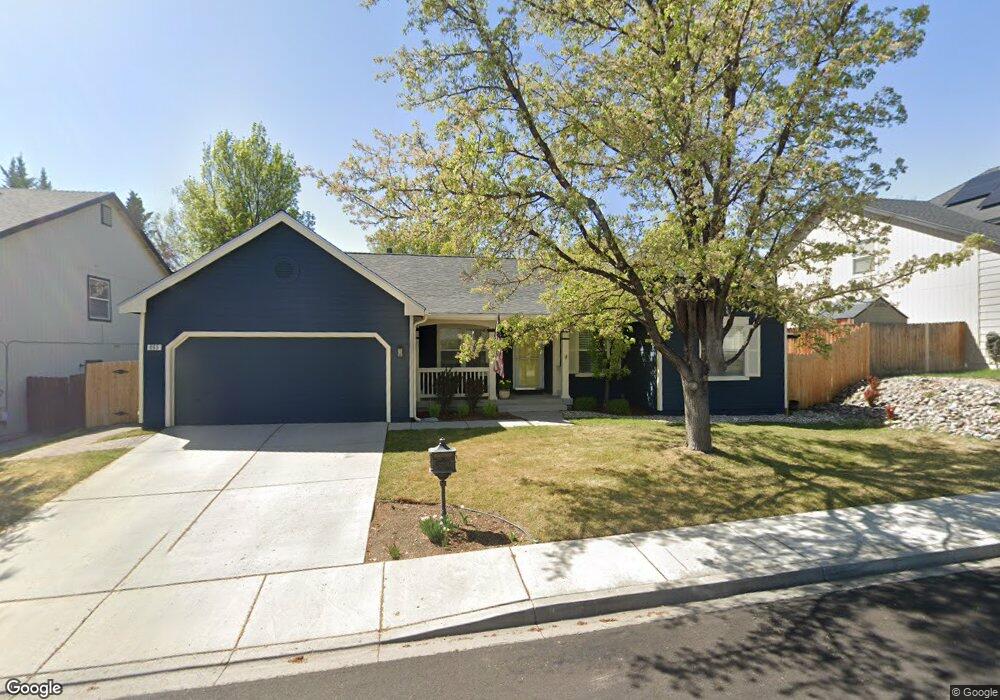
865 Vivian Dr Unit 2 Sparks, NV 89436
Reed NeighborhoodEstimated Value: $518,648 - $555,000
3
Beds
2
Baths
1,495
Sq Ft
$362/Sq Ft
Est. Value
About This Home
This home is located at 865 Vivian Dr Unit 2, Sparks, NV 89436 and is currently estimated at $540,662, approximately $361 per square foot. 865 Vivian Dr Unit 2 is a home located in Washoe County with nearby schools including Hershal H. Beam Elementary School, Lena Juniper Elementary School, and Lou Mendive Middle School.
Ownership History
Date
Name
Owned For
Owner Type
Purchase Details
Closed on
Aug 30, 2024
Sold by
Chinnici Charles A and Chinnici Cheryl M
Bought by
Chinnici Family Trust and Chinnici
Current Estimated Value
Purchase Details
Closed on
Jul 24, 2020
Sold by
Chinnici Cheryl and Chinnici Charles A
Bought by
Chinnici Charles A and Chinnici Cheryl M
Purchase Details
Closed on
Mar 20, 2008
Sold by
Chinnici Cheryl Mendoza
Bought by
Chinnici Cheryl and Chinnici Charles A
Home Financials for this Owner
Home Financials are based on the most recent Mortgage that was taken out on this home.
Original Mortgage
$243,000
Interest Rate
5.65%
Mortgage Type
New Conventional
Purchase Details
Closed on
Sep 1, 2004
Sold by
Chinnici Charles A
Bought by
Chinnici Cheryl Mendoza
Home Financials for this Owner
Home Financials are based on the most recent Mortgage that was taken out on this home.
Original Mortgage
$251,120
Interest Rate
5%
Mortgage Type
Purchase Money Mortgage
Purchase Details
Closed on
Aug 26, 2004
Sold by
Fye Patrick Lee and Fye Betty Arlene
Bought by
Chinnici Cheryl Mendoza
Home Financials for this Owner
Home Financials are based on the most recent Mortgage that was taken out on this home.
Original Mortgage
$251,120
Interest Rate
5%
Mortgage Type
Purchase Money Mortgage
Purchase Details
Closed on
May 13, 2002
Sold by
Filler Donald
Bought by
Filler Betty Arlene
Purchase Details
Closed on
Jul 14, 1998
Sold by
Hammond John Mark and Hammond Judy C
Bought by
Filler Don and Filler Arlene
Home Financials for this Owner
Home Financials are based on the most recent Mortgage that was taken out on this home.
Original Mortgage
$126,400
Interest Rate
7%
Purchase Details
Closed on
Jan 31, 1997
Sold by
Hammond Judy C
Bought by
Hammond John Mark
Home Financials for this Owner
Home Financials are based on the most recent Mortgage that was taken out on this home.
Original Mortgage
$165,315
Interest Rate
7.74%
Mortgage Type
VA
Purchase Details
Closed on
Aug 11, 1995
Sold by
Saddleback Associates
Bought by
Carter Christopher J and Carter Elizabeth D
Home Financials for this Owner
Home Financials are based on the most recent Mortgage that was taken out on this home.
Original Mortgage
$118,550
Interest Rate
7.5%
Create a Home Valuation Report for This Property
The Home Valuation Report is an in-depth analysis detailing your home's value as well as a comparison with similar homes in the area
Home Values in the Area
Average Home Value in this Area
Purchase History
| Date | Buyer | Sale Price | Title Company |
|---|---|---|---|
| Chinnici Family Trust | -- | None Listed On Document | |
| Chinnici Charles A | -- | Western Title Company | |
| Chinnici Cheryl | -- | Founders Title Company Of Nv | |
| Chinnici Cheryl Mendoza | -- | First American Title | |
| Chinnici Cheryl Mendoza | $315,000 | First American Title | |
| Filler Betty Arlene | $54,361 | -- | |
| Filler Don | $158,000 | First Centennial Title Co | |
| Hammond John Mark | -- | First Centennial Title Co | |
| Hammond John Mark | $160,500 | First Centennial Title Co | |
| Carter Christopher J | $155,500 | Founders Title Co |
Source: Public Records
Mortgage History
| Date | Status | Borrower | Loan Amount |
|---|---|---|---|
| Previous Owner | Chinnici Cheryl | $243,000 | |
| Previous Owner | Chinnici Cheryl Mendoza | $251,120 | |
| Previous Owner | Filler Don | $126,400 | |
| Previous Owner | Hammond John Mark | $165,315 | |
| Previous Owner | Carter Christopher J | $118,550 | |
| Closed | Chinnici Cheryl Mendoza | $62,980 |
Source: Public Records
Tax History Compared to Growth
Tax History
| Year | Tax Paid | Tax Assessment Tax Assessment Total Assessment is a certain percentage of the fair market value that is determined by local assessors to be the total taxable value of land and additions on the property. | Land | Improvement |
|---|---|---|---|---|
| 2025 | $2,439 | $107,882 | $45,605 | $62,277 |
| 2024 | $2,439 | $103,064 | $40,145 | $62,920 |
| 2023 | $2,369 | $102,909 | $43,120 | $59,789 |
| 2022 | $2,299 | $81,885 | $31,815 | $50,070 |
| 2021 | $2,233 | $75,103 | $25,130 | $49,973 |
| 2020 | $2,167 | $75,370 | $25,130 | $50,240 |
| 2019 | $2,104 | $73,745 | $24,360 | $49,385 |
| 2018 | $2,042 | $66,200 | $17,815 | $48,385 |
| 2017 | $1,984 | $66,297 | $17,710 | $48,587 |
| 2016 | $1,933 | $68,031 | $18,235 | $49,796 |
| 2015 | $1,930 | $64,723 | $14,805 | $49,918 |
| 2014 | $1,848 | $59,520 | $11,795 | $47,725 |
| 2013 | -- | $49,388 | $9,695 | $39,693 |
Source: Public Records
Map
Nearby Homes
- 3988 Ella Jayne Ct Unit Lot 6
- 1031 Vintage Hills Pkwy
- 3602 Oakridge Dr
- Plan 4 at Eagle Peak
- Plan 5 at Eagle Peak
- Plan 2 at Eagle Peak
- Plan 1 at Eagle Peak
- Plan 3 at Eagle Peak
- 510 S Sand Crane Cir
- 4515 Whitney Cir
- 519 N Sand Crane Cir
- 4434 Whitney Cir
- 930 Spanish Springs Rd
- 4719 Wood Thrush Ln
- 1069 Palmwood Dr
- 3595 Rocky Ridge Ct
- 4739 Wood Thrush Ln
- 4730 Tabuka Ln
- 1472 Giannotti Dr
- 3200 Bristle Branch Dr
- 875 Vivian Dr Unit 2
- 855 Vivian Dr
- 872 Francesca Way Unit 2
- 864 Francesca Way Unit 2
- 845 Vivian Dr
- 885 Vivian Dr
- 880 Francesca Way Unit 2
- 856 Francesca Way
- 866 Vivian Dr
- 876 Vivian Dr
- 856 Vivian Dr
- 888 Francesca Way
- 846 Francesca Way
- 886 Vivian Dr
- 835 Vivian Dr
- 846 Vivian Dr
- 865 Francesca Way
- 875 Francesca Way
- 867 Calle Myriam Unit 2
- 896 Vivian Dr