
Landlord's Agent in 2025
Juli McIntosh
RE/MAX ADVANTAGE GROUP
(401) 954-4880
107 Total Sales
Estimated Value: $359,751
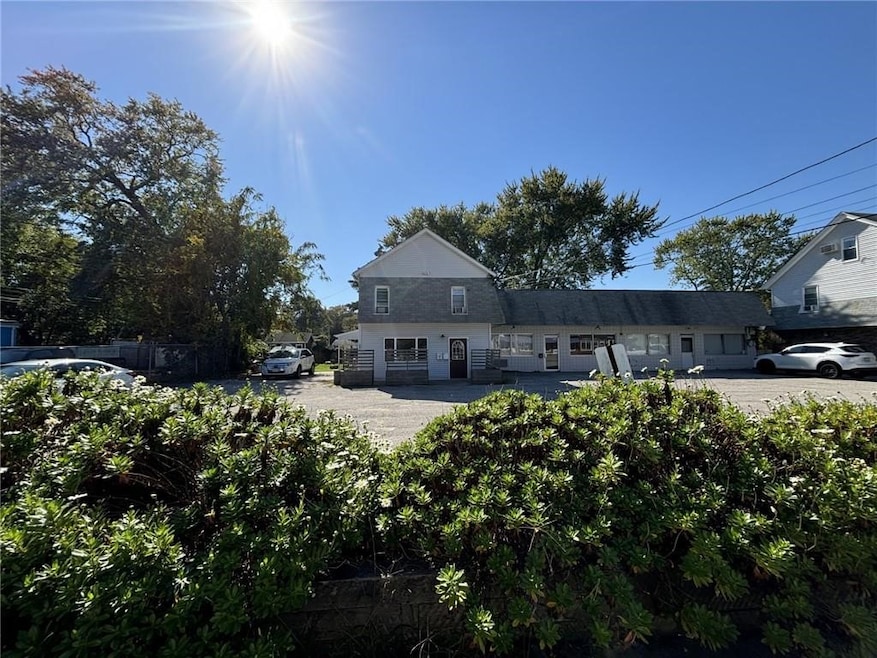
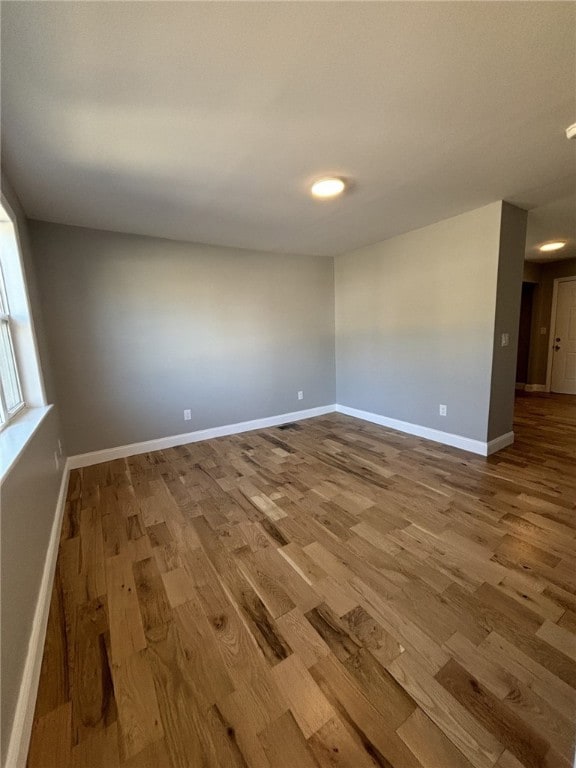
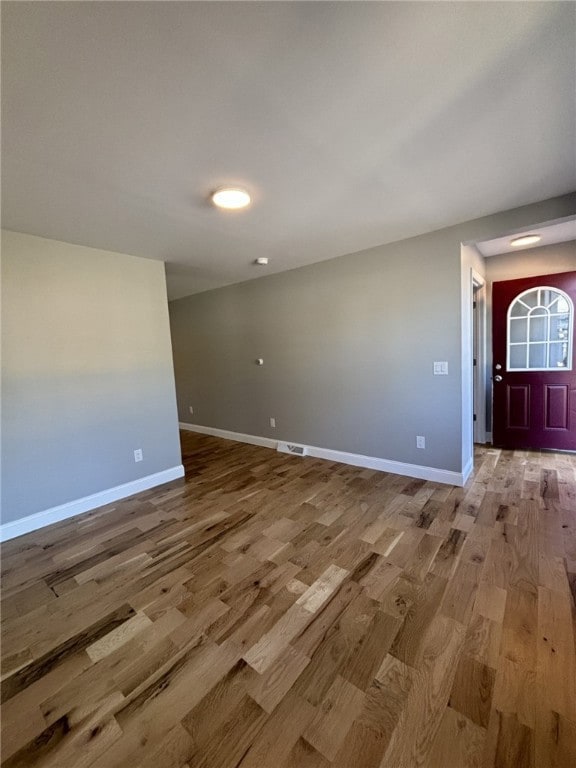
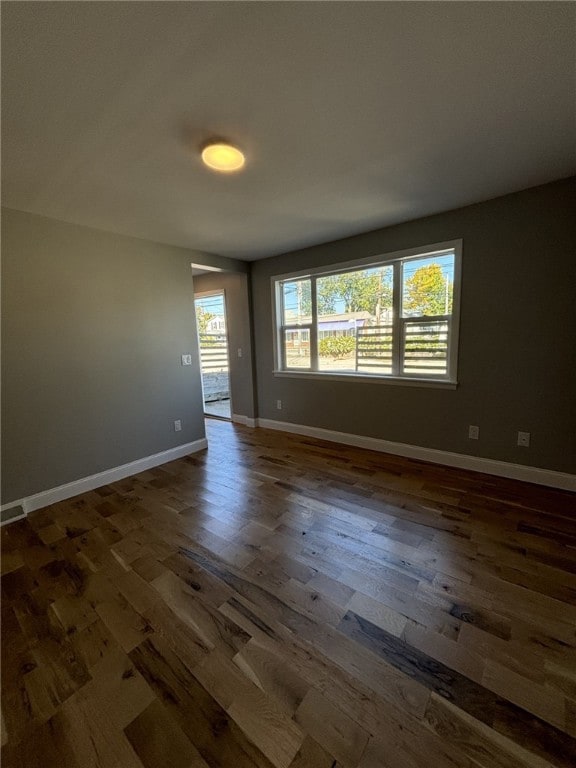
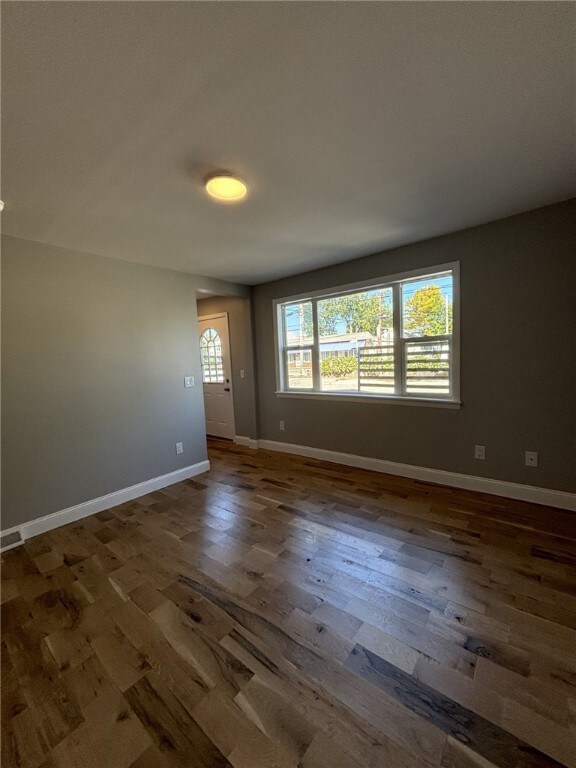
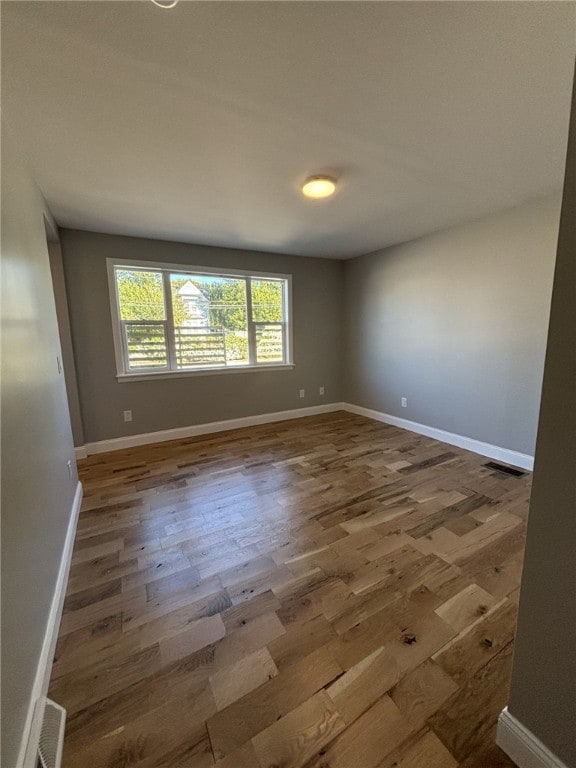
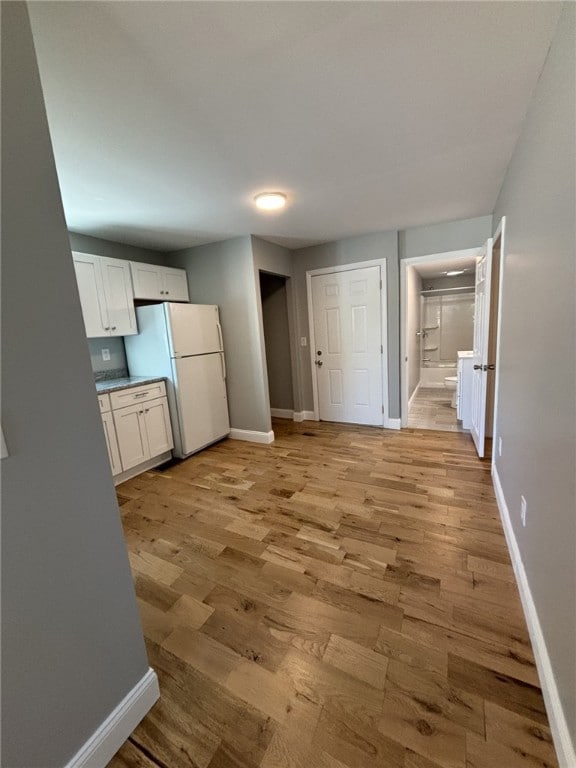
Be the first to live in this completely renovated 1-2 bedroom apartment located in the Conimicut section of Warwick. This bright, modern space has been gutted and redone from top to bottom, offering brand new finishes throughout. Enjoy gleaming hardwood floors, fresh paint, new kitchen cabinets, stainless steel appliances, and a fully updated bathroom. The flexible floor plan allows for one or two bedrooms, perfect for a home office or guest space. Perfect for one or two persons. The larger bedroom does not have a closet. Additional features include laundry hookups in-unit, plenty of off-street parking, and a quiet residential location close to beaches, shops, and local amenities. Walking distance to restaurants, shops and Conimicut beach. Small dog negotiable. No smoking. One-year minimum lease. Background check required. Don't miss this opportunity to rent a move-in-ready home in one of Warwick's most charming neighborhoods! Owner pays for water, sewer. Tenant pays for electricity, heat, internet. Small dog negotiable. No smoking. One year minimum.
Last Agent to Rent the Property
RE/MAX ADVANTAGE GROUP License #RES.0044817 Listed on: 11/01/2025
| Date | Buyer | Sale Price | Title Company |
|---|---|---|---|
| Breslin Joseph T | -- | None Available | |
| Breslin Joseph T | $70,000 | -- | |
| Breslin Joseph T | $70,000 | -- |
| Date | Status | Borrower | Loan Amount |
|---|---|---|---|
| Previous Owner | Breslin Joseph T | $130,350 | |
| Previous Owner | Breslin Joseph T | $66,400 |
| Date | Event | Price | List to Sale | Price per Sq Ft |
|---|---|---|---|---|
| 11/20/2025 11/20/25 | Rented | $1,700 | 0.0% | -- |
| 11/01/2025 11/01/25 | For Rent | $1,700 | -- | -- |
| Year | Tax Paid | Tax Assessment Tax Assessment Total Assessment is a certain percentage of the fair market value that is determined by local assessors to be the total taxable value of land and additions on the property. | Land | Improvement |
|---|---|---|---|---|
| 2025 | $3,918 | $308,500 | $100,900 | $207,600 |
| 2024 | $3,432 | $237,200 | $83,400 | $153,800 |
| 2023 | $3,366 | $237,200 | $83,400 | $153,800 |
| 2022 | $3,169 | $169,200 | $51,200 | $118,000 |
| 2021 | $3,169 | $169,200 | $51,200 | $118,000 |
| 2020 | $3,169 | $169,200 | $51,200 | $118,000 |
| 2019 | $3,169 | $169,200 | $51,200 | $118,000 |
| 2018 | $2,737 | $131,600 | $51,200 | $80,400 |
| 2017 | $2,664 | $131,600 | $51,200 | $80,400 |
| 2016 | $2,664 | $131,600 | $51,200 | $80,400 |
| 2015 | $2,754 | $132,700 | $54,200 | $78,500 |
| 2014 | $2,662 | $132,700 | $54,200 | $78,500 |
| 2013 | $2,626 | $132,700 | $54,200 | $78,500 |
Landlord's Agent in 2025
Juli McIntosh
RE/MAX ADVANTAGE GROUP
(401) 954-4880
107 Total Sales
Source: State-Wide MLS
MLS Number: 1399243
APN: WARW-000332-000743-000000
Disclaimer: Certain information contained herein is derived from information provided by parties other than Homes.com. All information provided is deemed reliable, but is not guaranteed to be accurate and should be independently verified.
![]() IDX information is provided exclusively for personal, non-commercial use, and may not be used for any purpose other than to identify prospective properties consumers may be interested in purchasing. Information is deemed reliable but not guaranteed.
IDX information is provided exclusively for personal, non-commercial use, and may not be used for any purpose other than to identify prospective properties consumers may be interested in purchasing. Information is deemed reliable but not guaranteed.
Copyright © 2025 State-Wide MLS, Inc. All rights reserved.