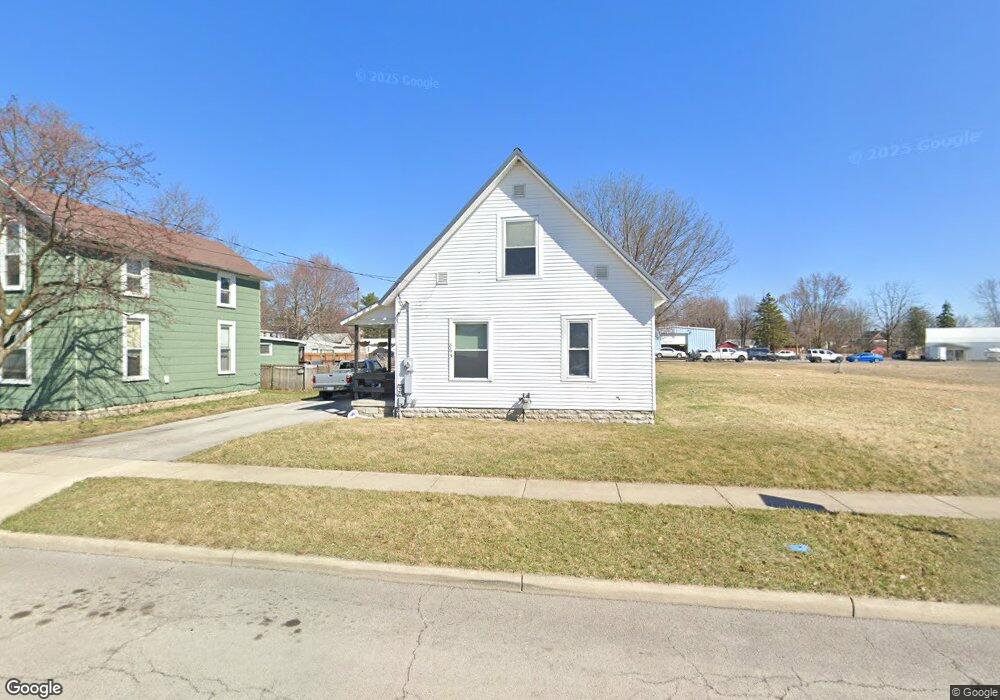
865 Wilson St Findlay, OH 45840
Estimated Value: $144,000 - $177,000
3
Beds
2
Baths
1,272
Sq Ft
$131/Sq Ft
Est. Value
About This Home
This home is located at 865 Wilson St, Findlay, OH 45840 and is currently estimated at $166,464, approximately $130 per square foot. 865 Wilson St is a home located in Hancock County with nearby schools including Whittier Elementary School, Wilson Vance Elementary School, and Donnell Middle School.
Ownership History
Date
Name
Owned For
Owner Type
Purchase Details
Closed on
Nov 18, 2021
Sold by
Slough Joshua and Slough Elizabeth A
Bought by
Phillips Christopher
Current Estimated Value
Home Financials for this Owner
Home Financials are based on the most recent Mortgage that was taken out on this home.
Original Mortgage
$139,428
Outstanding Balance
$127,762
Interest Rate
2.99%
Mortgage Type
FHA
Estimated Equity
$38,702
Purchase Details
Closed on
Jul 29, 2021
Sold by
Thomas Alan R and Toeppe Sherry A
Bought by
Slough Joshua
Home Financials for this Owner
Home Financials are based on the most recent Mortgage that was taken out on this home.
Original Mortgage
$440,000
Interest Rate
2.1%
Purchase Details
Closed on
Jun 12, 2002
Sold by
Monday Ralph R
Bought by
Thomas Alan R and Toeppe Sherry A
Create a Home Valuation Report for This Property
The Home Valuation Report is an in-depth analysis detailing your home's value as well as a comparison with similar homes in the area
Home Values in the Area
Average Home Value in this Area
Purchase History
| Date | Buyer | Sale Price | Title Company |
|---|---|---|---|
| Phillips Christopher | $142,000 | None Available | |
| Slough Joshua | $115,000 | Whitman Title Security | |
| Thomas Alan R | $27,000 | -- |
Source: Public Records
Mortgage History
| Date | Status | Borrower | Loan Amount |
|---|---|---|---|
| Open | Phillips Christopher | $139,428 | |
| Previous Owner | Slough Joshua | $440,000 |
Source: Public Records
Tax History
| Year | Tax Paid | Tax Assessment Tax Assessment Total Assessment is a certain percentage of the fair market value that is determined by local assessors to be the total taxable value of land and additions on the property. | Land | Improvement |
|---|---|---|---|---|
| 2024 | $1,282 | $36,100 | $5,180 | $30,920 |
| 2023 | $1,284 | $36,100 | $5,180 | $30,920 |
| 2022 | $1,280 | $36,100 | $5,180 | $30,920 |
| 2021 | $1,092 | $26,830 | $5,180 | $21,650 |
| 2020 | $1,121 | $26,830 | $5,180 | $21,650 |
| 2019 | $1,099 | $26,830 | $5,180 | $21,650 |
| 2018 | $956 | $21,380 | $4,710 | $16,670 |
| 2017 | $955 | $21,380 | $4,710 | $16,670 |
| 2016 | $952 | $21,380 | $4,710 | $16,670 |
| 2015 | $850 | $18,910 | $4,710 | $14,200 |
| 2014 | $851 | $18,910 | $4,710 | $14,200 |
| 2012 | $847 | $18,630 | $4,710 | $13,920 |
Source: Public Records
Map
Nearby Homes
- 15591 Canadian Way
- 15586 Canadian Way
- 15615 Canadian Way
- 623 E Sandusky St
- 829 Maple Ave
- 313 2nd St
- 216 1st St
- 731 5th St
- 865 S Main St
- 1037 Fishlock Ave
- 1100 Stall Dr
- 1105 1st St
- 206 Greenlawn Ave
- 1001 Decker Ave
- 123 Glendale Ave
- 309 Huron Rd
- 655 Clinton Ct
- 0 Blanchard Ave
- 1120 S West St
- 815 Liberty St
Your Personal Tour Guide
Ask me questions while you tour the home.