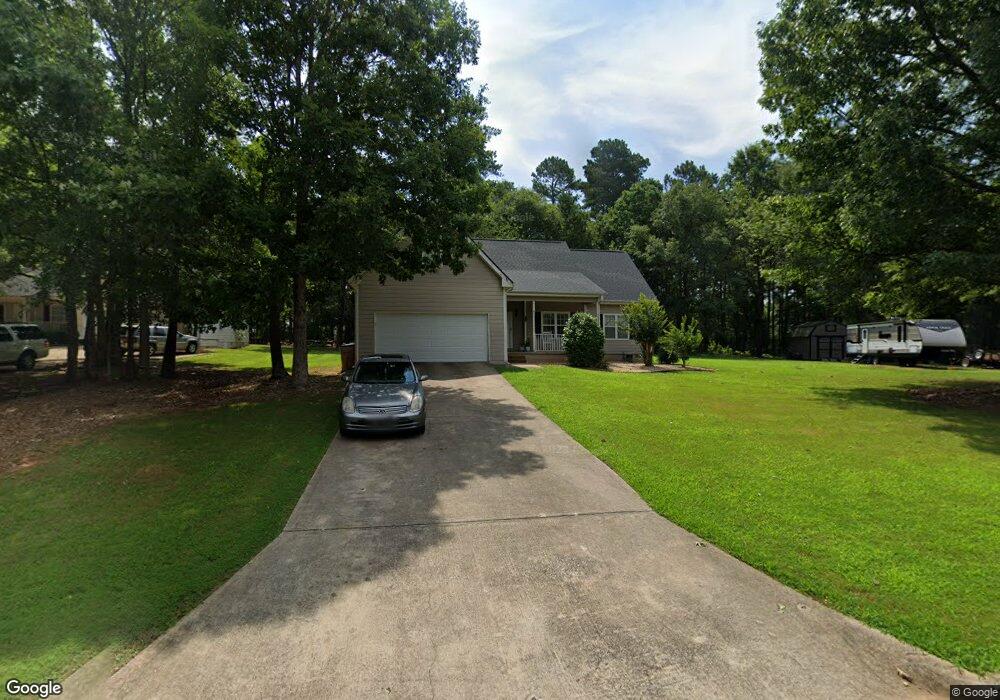
865 Windward Rd Winder, GA 30680
Estimated Value: $308,372 - $359,000
--
Bed
2
Baths
1,901
Sq Ft
$177/Sq Ft
Est. Value
About This Home
This home is located at 865 Windward Rd, Winder, GA 30680 and is currently estimated at $336,343, approximately $176 per square foot. 865 Windward Rd is a home located in Barrow County with nearby schools including Holsenbeck Elementary School, Bear Creek Middle School, and Winder-Barrow High School.
Ownership History
Date
Name
Owned For
Owner Type
Purchase Details
Closed on
Apr 25, 2001
Sold by
Mcilwain John C And
Bought by
Mcilwain John C And
Current Estimated Value
Home Financials for this Owner
Home Financials are based on the most recent Mortgage that was taken out on this home.
Original Mortgage
$28,000
Outstanding Balance
$10,393
Interest Rate
6.95%
Mortgage Type
New Conventional
Estimated Equity
$325,950
Purchase Details
Closed on
Mar 31, 1999
Sold by
Bryler Homes Inc
Bought by
Mcllwain John C and Mcllwain Carmen S
Home Financials for this Owner
Home Financials are based on the most recent Mortgage that was taken out on this home.
Original Mortgage
$110,489
Interest Rate
6.82%
Mortgage Type
FHA
Purchase Details
Closed on
Nov 20, 1998
Sold by
Dun La Hur Dev
Bought by
Bryler Hms Inc
Home Financials for this Owner
Home Financials are based on the most recent Mortgage that was taken out on this home.
Original Mortgage
$81,000
Interest Rate
6.47%
Mortgage Type
Construction
Purchase Details
Closed on
Apr 21, 1997
Bought by
Developme Dun La Hur
Create a Home Valuation Report for This Property
The Home Valuation Report is an in-depth analysis detailing your home's value as well as a comparison with similar homes in the area
Home Values in the Area
Average Home Value in this Area
Purchase History
| Date | Buyer | Sale Price | Title Company |
|---|---|---|---|
| Mcilwain John C And | -- | -- | |
| Mcllwain John C | $111,400 | -- | |
| Bryler Hms Inc | $16,000 | -- | |
| Bryler Homes Inc | $16,000 | -- | |
| Developme Dun La Hur | -- | -- |
Source: Public Records
Mortgage History
| Date | Status | Borrower | Loan Amount |
|---|---|---|---|
| Open | Mcilwain John C And | $28,000 | |
| Closed | Mcilwain John C And | $28,000 | |
| Previous Owner | Mcllwain John C | $110,489 | |
| Previous Owner | Bryler Homes Inc | $81,000 |
Source: Public Records
Tax History Compared to Growth
Tax History
| Year | Tax Paid | Tax Assessment Tax Assessment Total Assessment is a certain percentage of the fair market value that is determined by local assessors to be the total taxable value of land and additions on the property. | Land | Improvement |
|---|---|---|---|---|
| 2024 | $2,057 | $92,138 | $22,000 | $70,138 |
| 2023 | $1,647 | $92,538 | $22,000 | $70,538 |
| 2022 | $2,203 | $85,793 | $22,000 | $63,793 |
| 2021 | $1,865 | $67,114 | $16,000 | $51,114 |
| 2020 | $1,861 | $67,114 | $16,000 | $51,114 |
| 2019 | $1,888 | $67,114 | $16,000 | $51,114 |
| 2018 | $1,635 | $57,375 | $12,600 | $44,775 |
| 2017 | $1,381 | $47,442 | $12,600 | $34,842 |
| 2016 | $1,321 | $46,105 | $12,600 | $33,505 |
| 2015 | $1,339 | $46,490 | $12,600 | $33,890 |
| 2014 | $1,165 | $40,449 | $6,174 | $34,275 |
| 2013 | -- | $37,948 | $6,174 | $31,774 |
Source: Public Records
Map
Nearby Homes
- 867 Windward Rd
- 388 Kay Dr Unit 1
- 508 Pleasant Hill Church Rd NE
- 917 Justin Dr Unit 3
- 91 Beech Creek Cir
- 1206 Corkybrooke Ln
- 105 Beech Creek Cir
- 1556 Shoal Creek Dr
- 1553 Shoal Creek Dr
- 614 Anns Way
- 130 (Tract 1) Bowman Mill Rd NE
- 130 Bowman Mill Rd NE Unit 1
- 0 Hancock Bridge Rd Unit 10535063
- 63 Delightful Way Unit 1
- 1212 Highway 211 NE
- 1226 Highway 211 NE
- 162 Delightful Way Unit 28
- 173 Equestrian Walk
- 203 Delightful Way Unit 5
- 230 Delightful Way Unit 23
- 863 Windward Ro 863 Windward Rd Unit 2
- 863 Windward Rd
- 863 Windward Rd Unit 2
- 861 Windward Rd
- 869 Windward Rd
- 862 Windward Rd
- 866 Windward Rd
- 89 Windward Rd
- 870 Windward Rd
- 871 Windward Rd
- 903 Windward Ct
- 872 Windward Rd
- 873 Windward Rd
- 905 Windward Ct
- 878 Windward Rd
- 906 Windward Ct
- 938 Highway 211 NE
- 400 Breeze Way Unit 8
- 400 Breeze Way Unit 8
- 882 Windward Rd