86508 Holmes Unit 383 Chapel Hill, NC 27517
Governors Club NeighborhoodEstimated Value: $704,000 - $1,097,000
4
Beds
4
Baths
3,077
Sq Ft
$294/Sq Ft
Est. Value
About This Home
This home is located at 86508 Holmes Unit 383, Chapel Hill, NC 27517 and is currently estimated at $904,202, approximately $293 per square foot. 86508 Holmes Unit 383 is a home located in Chatham County with nearby schools including North Chatham Elementary School and Margaret B. Pollard Middle School.
Ownership History
Date
Name
Owned For
Owner Type
Purchase Details
Closed on
Jan 29, 2016
Sold by
Jsa Homes Inc
Bought by
Kerns William W and Kerns Martha H
Current Estimated Value
Purchase Details
Closed on
Dec 18, 2013
Sold by
Anderson Jeffrey S
Bought by
Jsa Homes Inc
Purchase Details
Closed on
Feb 12, 2013
Sold by
Jsa Homes Inc
Bought by
Anderson Jeffrey S and Anderson Jennifer
Purchase Details
Closed on
Jan 26, 2011
Sold by
Breeden Douglas T and Breeden Josie C
Bought by
Jsa Homes Inc
Create a Home Valuation Report for This Property
The Home Valuation Report is an in-depth analysis detailing your home's value as well as a comparison with similar homes in the area
Home Values in the Area
Average Home Value in this Area
Purchase History
| Date | Buyer | Sale Price | Title Company |
|---|---|---|---|
| Kerns William W | $520,000 | Attorney | |
| Jsa Homes Inc | $52,000 | None Available | |
| Anderson Jeffrey S | $50,000 | None Available | |
| Jsa Homes Inc | $45,000 | None Available |
Source: Public Records
Tax History Compared to Growth
Tax History
| Year | Tax Paid | Tax Assessment Tax Assessment Total Assessment is a certain percentage of the fair market value that is determined by local assessors to be the total taxable value of land and additions on the property. | Land | Improvement |
|---|---|---|---|---|
| 2024 | $5,475 | $451,784 | $59,020 | $392,764 |
| 2023 | $3,991 | $451,784 | $59,020 | $392,764 |
| 2022 | $3,537 | $451,784 | $59,020 | $392,764 |
| 2021 | $3,617 | $451,784 | $59,020 | $392,764 |
| 2020 | $3,623 | $449,559 | $106,250 | $343,309 |
| 2019 | $3,623 | $449,559 | $106,250 | $343,309 |
| 2018 | $3,433 | $449,559 | $106,250 | $343,309 |
| 2017 | $3,468 | $449,559 | $106,250 | $343,309 |
| 2016 | $3,933 | $516,777 | $125,000 | $391,777 |
| 2015 | $3,871 | $516,777 | $125,000 | $391,777 |
| 2014 | $799 | $112,500 | $112,500 | $0 |
| 2013 | -- | $112,500 | $112,500 | $0 |
Source: Public Records
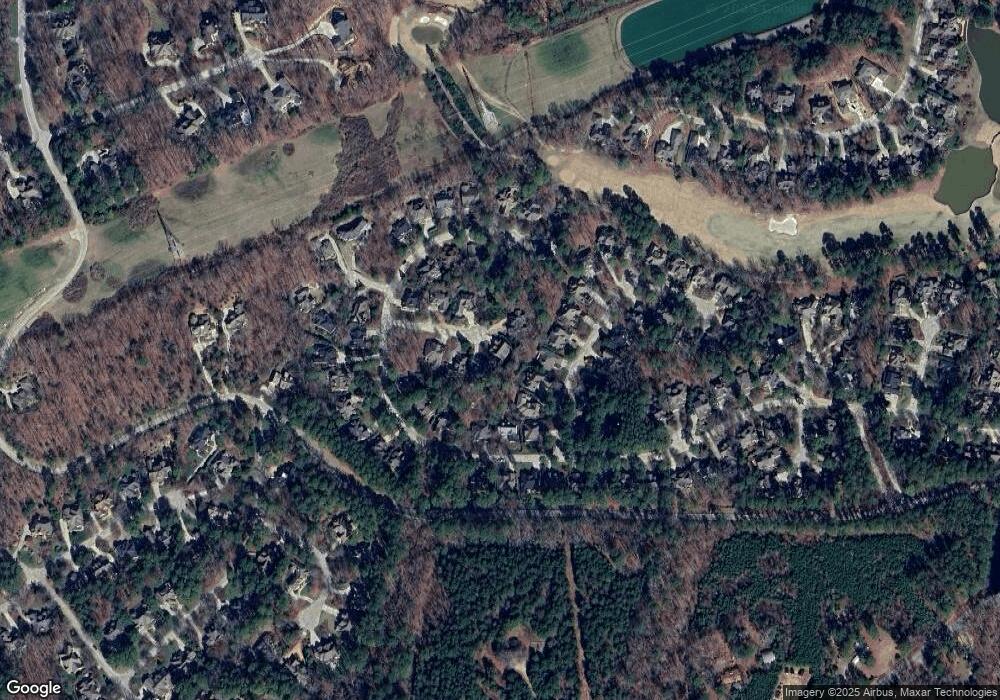
Map
Nearby Homes