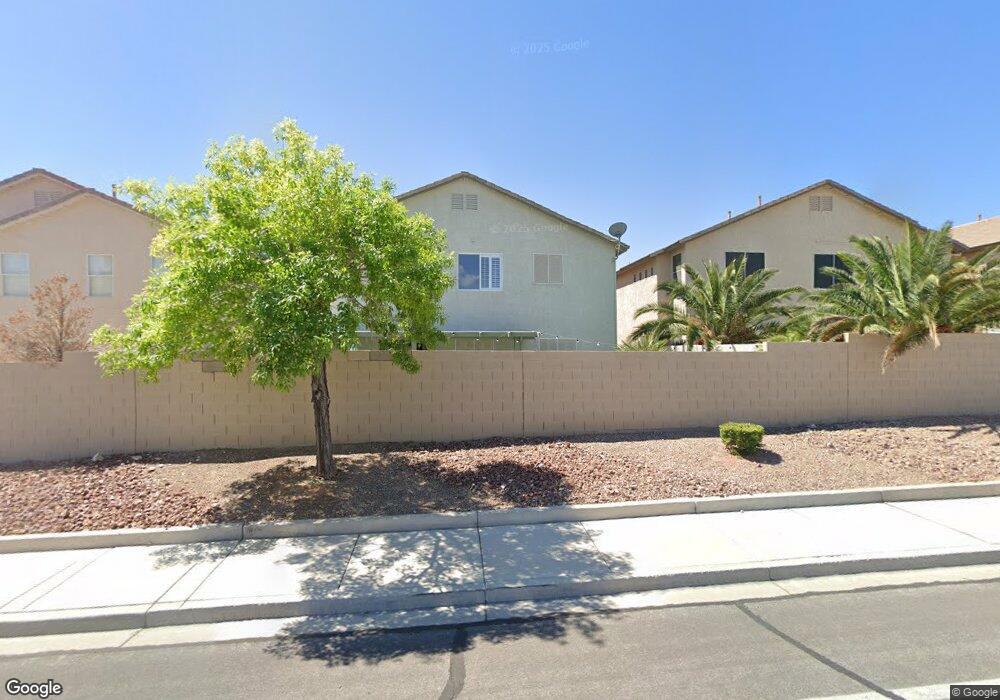
8652 Honey Vine Ave Las Vegas, NV 89143
Estimated Value: $487,000 - $522,000
3
Beds
3
Baths
2,156
Sq Ft
$236/Sq Ft
Est. Value
About This Home
This home is located at 8652 Honey Vine Ave, Las Vegas, NV 89143 and is currently estimated at $509,254, approximately $236 per square foot. 8652 Honey Vine Ave is a home located in Clark County with nearby schools including James Bilbray Elementary School, William & Mary Scherkenbach Elementary School, and Ralph Cadwallader Middle School.
Ownership History
Date
Name
Owned For
Owner Type
Purchase Details
Closed on
Jun 21, 2021
Sold by
Brattain Cassandra A and Brattain Garrett W
Bought by
Arnold Kimberly and Arnold Louis
Current Estimated Value
Home Financials for this Owner
Home Financials are based on the most recent Mortgage that was taken out on this home.
Original Mortgage
$388,000
Outstanding Balance
$351,286
Interest Rate
2.9%
Mortgage Type
New Conventional
Estimated Equity
$157,968
Purchase Details
Closed on
Jul 6, 2020
Sold by
Brattain Garrett W and Brattain Cassandra A
Bought by
Brattain Cassandra A and Brattain Garrett W
Home Financials for this Owner
Home Financials are based on the most recent Mortgage that was taken out on this home.
Original Mortgage
$230,000
Interest Rate
3.1%
Mortgage Type
New Conventional
Purchase Details
Closed on
Jul 21, 2015
Sold by
Wills Araceli Juanita and Wills Patrick
Bought by
Brattain Garrett W and Brattain Cassandra A
Home Financials for this Owner
Home Financials are based on the most recent Mortgage that was taken out on this home.
Original Mortgage
$245,471
Interest Rate
4.37%
Mortgage Type
FHA
Purchase Details
Closed on
Jan 20, 2012
Sold by
Red Rock Region Investments Llc
Bought by
Grijalva Araceli Juanita and Wills Patrick
Home Financials for this Owner
Home Financials are based on the most recent Mortgage that was taken out on this home.
Original Mortgage
$162,418
Interest Rate
3.86%
Mortgage Type
VA
Purchase Details
Closed on
Oct 10, 2011
Sold by
Riley Travenio and Riley Tammy
Bought by
Red Rock Region Investments Llc
Purchase Details
Closed on
Sep 7, 2006
Sold by
Riley Tammy
Bought by
Riley Travenio and Riley Tammy
Home Financials for this Owner
Home Financials are based on the most recent Mortgage that was taken out on this home.
Original Mortgage
$336,000
Interest Rate
6.62%
Mortgage Type
Unknown
Purchase Details
Closed on
Aug 30, 2004
Sold by
Riley Travenio
Bought by
Riley Tammy
Home Financials for this Owner
Home Financials are based on the most recent Mortgage that was taken out on this home.
Original Mortgage
$292,500
Interest Rate
7.75%
Mortgage Type
New Conventional
Purchase Details
Closed on
Dec 20, 1999
Sold by
Astoria Trails South Llc
Bought by
Riley Travenio and Riley Tammy S
Home Financials for this Owner
Home Financials are based on the most recent Mortgage that was taken out on this home.
Original Mortgage
$138,850
Interest Rate
7.69%
Create a Home Valuation Report for This Property
The Home Valuation Report is an in-depth analysis detailing your home's value as well as a comparison with similar homes in the area
Home Values in the Area
Average Home Value in this Area
Purchase History
| Date | Buyer | Sale Price | Title Company |
|---|---|---|---|
| Arnold Kimberly | $450,000 | Equity Title Of Nevada | |
| Brattain Cassandra A | -- | Wfg National Title Compan | |
| Brattain Garrett W | $250,000 | Chicago Title Las Vegas | |
| Grijalva Araceli Juanita | $159,000 | Nevada Title Las Vegas | |
| Red Rock Region Investments Llc | $118,100 | Accommodation | |
| Riley Travenio | -- | First Amer Title Co Of Nv | |
| Riley Tammy | -- | First American Title Co Of | |
| Riley Travenio | $154,300 | First American Title Co |
Source: Public Records
Mortgage History
| Date | Status | Borrower | Loan Amount |
|---|---|---|---|
| Open | Arnold Kimberly | $388,000 | |
| Previous Owner | Brattain Cassandra A | $230,000 | |
| Previous Owner | Brattain Garrett W | $245,471 | |
| Previous Owner | Grijalva Araceli Juanita | $162,418 | |
| Previous Owner | Riley Travenio | $336,000 | |
| Previous Owner | Riley Tammy | $292,500 | |
| Previous Owner | Riley Travenio | $138,850 |
Source: Public Records
Tax History Compared to Growth
Tax History
| Year | Tax Paid | Tax Assessment Tax Assessment Total Assessment is a certain percentage of the fair market value that is determined by local assessors to be the total taxable value of land and additions on the property. | Land | Improvement |
|---|---|---|---|---|
| 2025 | $2,317 | $128,116 | $32,900 | $95,216 |
| 2024 | $2,250 | $128,116 | $32,900 | $95,216 |
| 2023 | $1,836 | $124,303 | $34,650 | $89,653 |
| 2022 | $2,185 | $111,686 | $29,400 | $82,286 |
| 2021 | $2,121 | $102,271 | $24,150 | $78,121 |
| 2020 | $2,057 | $101,310 | $23,800 | $77,510 |
| 2019 | $1,997 | $98,789 | $22,400 | $76,389 |
| 2018 | $1,939 | $91,239 | $17,850 | $73,389 |
| 2017 | $2,982 | $90,978 | $16,450 | $74,528 |
| 2016 | $1,836 | $74,247 | $13,300 | $60,947 |
| 2015 | $1,832 | $59,273 | $9,800 | $49,473 |
| 2014 | $1,775 | $52,539 | $8,750 | $43,789 |
Source: Public Records
Map
Nearby Homes
- 8708 Honey Vine Ave
- 8625 Wild Diamond Ave
- 8020 Copperhead Creek St
- 8108 Terracotta Gulf Ct
- 8728 Burning Hide Ave Unit 1
- 8021 Dancing Springs St
- 7948 Quick Pine St
- 8421 Cheerful Brook Ave
- 8908 Happy Stream Ave
- 7909 Hollow Pine St Unit 2
- 8920 Iron Hitch Ave
- 8640 Horse Dr
- 8833 Spinning Wheel Ave
- 7864 Nesting Pine Place
- 8225 Dusty Valley Ct
- 8120 Finch Feather St
- 8701 Shady Pines Dr
- 8225 Romantic Sunset St
- 7957 Lovely Pine Place
- 9029 Tumblewood Ave
- 8700 Honey Vine Ave
- 8648 Honey Vine Ave
- 8648 Honey Vine Ave Unit n/a
- 8704 Honey Vine Ave
- 8644 Honey Vine Ave
- 8125 Harbor Grey Ct
- 8124 Jade Harbor Ct
- 8640 Honey Vine Ave
- 8121 Harbor Grey Ct
- 8124 Harbor Grey Ct
- 8120 Jade Harbor Ct
- 8641 Wild Diamond Ave
- 8637 Wild Diamond Ave
- 8701 Wild Diamond Ave
- 8636 Honey Vine Ave
- 8712 Honey Vine Ave Unit 1
- 8117 Harbor Grey Ct
- 8117 Harbor Grey Ct Unit 3
- 8633 Wild Diamond Ave
- 8120 Harbor Grey Ct