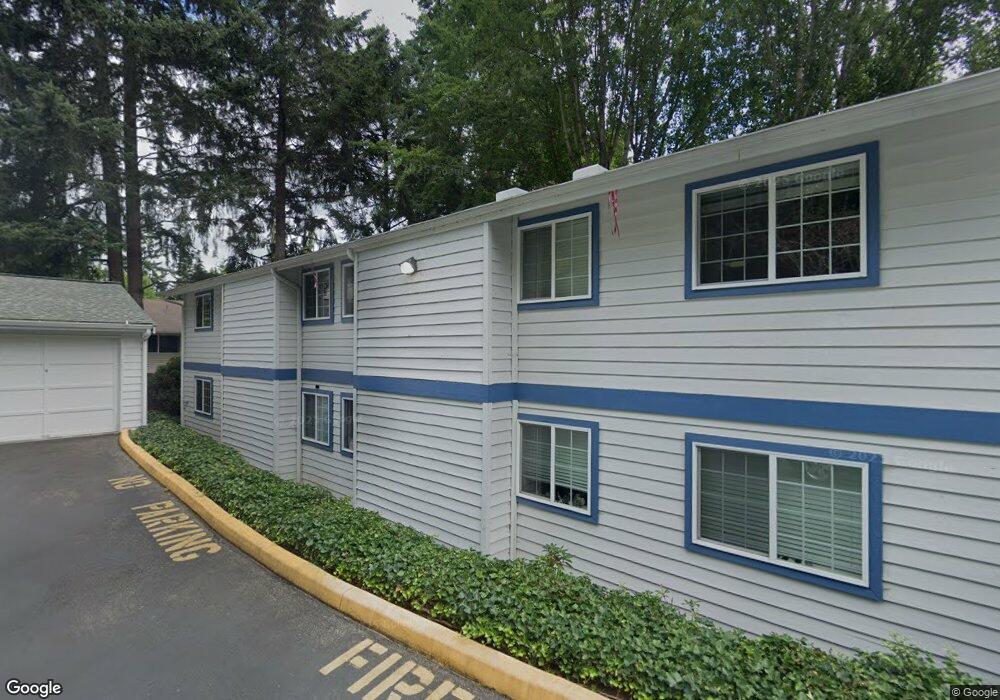
8653 Avondale Rd NE Unit B10 Redmond, WA 98052
Education Hill NeighborhoodEstimated Value: $571,000 - $604,000
3
Beds
2
Baths
1,084
Sq Ft
$548/Sq Ft
Est. Value
About This Home
This home is located at 8653 Avondale Rd NE Unit B10, Redmond, WA 98052 and is currently estimated at $593,877, approximately $547 per square foot. 8653 Avondale Rd NE Unit B10 is a home located in King County with nearby schools including Albert Einstein Elementary School, Evergreen Middle School, and Redmond High School.
Ownership History
Date
Name
Owned For
Owner Type
Purchase Details
Closed on
Feb 21, 2002
Sold by
Nguyen Huy Q and Vu Chi Kim
Bought by
Ballesteros Rafael and Sanchez Esther
Current Estimated Value
Home Financials for this Owner
Home Financials are based on the most recent Mortgage that was taken out on this home.
Original Mortgage
$166,250
Outstanding Balance
$61,713
Interest Rate
5.62%
Estimated Equity
$532,164
Purchase Details
Closed on
Dec 12, 1998
Sold by
Vu Chi Kim
Bought by
Nguyen Huy Q
Home Financials for this Owner
Home Financials are based on the most recent Mortgage that was taken out on this home.
Original Mortgage
$133,000
Interest Rate
6.86%
Purchase Details
Closed on
Apr 8, 1992
Sold by
Fey Virginia L
Bought by
Peltier Norman L and Peltier Peltier
Create a Home Valuation Report for This Property
The Home Valuation Report is an in-depth analysis detailing your home's value as well as a comparison with similar homes in the area
Home Values in the Area
Average Home Value in this Area
Purchase History
| Date | Buyer | Sale Price | Title Company |
|---|---|---|---|
| Ballesteros Rafael | $175,000 | Chicago Title | |
| Nguyen Huy Q | -- | -- | |
| Nguyen Huy Q | $145,000 | -- | |
| Peltier Norman L | $116,000 | -- |
Source: Public Records
Mortgage History
| Date | Status | Borrower | Loan Amount |
|---|---|---|---|
| Open | Ballesteros Rafael | $166,250 | |
| Previous Owner | Nguyen Huy Q | $133,000 |
Source: Public Records
Tax History Compared to Growth
Tax History
| Year | Tax Paid | Tax Assessment Tax Assessment Total Assessment is a certain percentage of the fair market value that is determined by local assessors to be the total taxable value of land and additions on the property. | Land | Improvement |
|---|---|---|---|---|
| 2024 | $4,264 | $541,000 | $131,600 | $409,400 |
| 2023 | $3,740 | $527,000 | $131,600 | $395,400 |
| 2022 | $3,838 | $507,000 | $116,900 | $390,100 |
| 2021 | $3,668 | $445,000 | $116,900 | $328,100 |
| 2020 | $3,776 | $393,000 | $116,900 | $276,100 |
| 2018 | $3,035 | $373,000 | $87,700 | $285,300 |
| 2017 | $2,344 | $303,000 | $65,800 | $237,200 |
| 2016 | $2,240 | $244,000 | $62,100 | $181,900 |
| 2015 | $2,241 | $231,000 | $58,400 | $172,600 |
| 2014 | -- | $223,000 | $51,100 | $171,900 |
| 2013 | -- | $173,000 | $43,800 | $129,200 |
Source: Public Records
Map
Nearby Homes
- 17928 NE 90th St
- 9009 Avondale Rd NE Unit D107
- 18003 NE 93rd Ct Unit 3
- 18010 NE 94th Ct Unit 2
- 9717 178th Place NE Unit 3
- 17020 NE 93rd Ct
- 17028 NE 80th St Unit C2
- 18247 NE 96th Way Unit 104
- 18258 NE 96th Way Unit 103
- Stafford B Plan at Penny Lane
- 7988 170th Ave Ne (Homesite #14)
- 7986 170th Ave Ne (Homesite #13)
- 7982 170th Ave Ne (Homesite #11)
- 18425 NE 95th St Unit 110
- 18425 NE 95th St Unit 76
- 18425 NE 95th St Unit 146
- 7980 170th Ave Ne (Homesite #10)
- 9805 Avondale Rd NE Unit T254
- 8835 166th Ave NE Unit D102
- 9948 184th Ave NE
- 8653 Avondale Rd NE Unit D108
- 8653 Avondale Rd NE Unit C206
- 8653 Avondale Rd NE Unit A302
- 8653 Avondale Rd NE Unit D 107
- 8653 Avondale Rd NE Unit B303
- 8653 Avondale Rd NE Unit C105
- 8653 Avondale Rd NE Unit C205
- 8653 Avondale Rd NE Unit D-207
- 8653 Avondale Rd NE
- 8653 Avondale Rd NE Unit B103
- 8653 Avondale Rd NE Unit D20
- 8653 Avondale Rd NE Unit C20
- 8653 Avondale Rd NE Unit D10
- 8653 Avondale Rd NE Unit C10
- 8653 Avondale Rd NE Unit B30
- 8653 Avondale Rd NE Unit A10
- 8653 Avondale Rd NE Unit B20
- 8653 Avondale Rd NE Unit A30
- 8653 Avondale Rd NE Unit A20
- 8653 Avondale Rd NE Unit D20