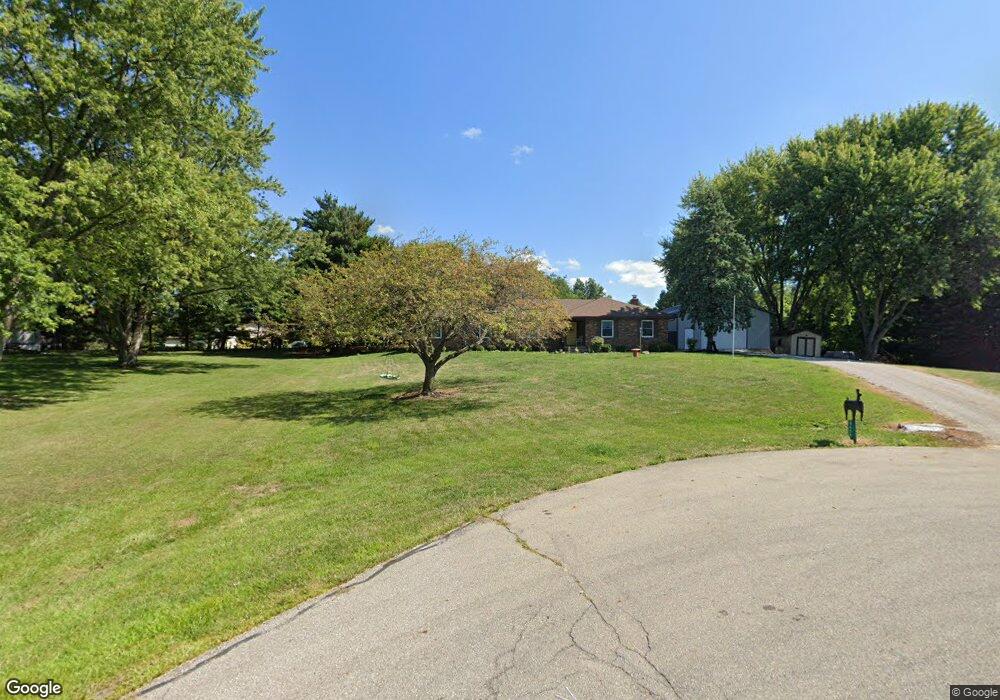
8654 Mount Union Ct NW Lancaster, OH 43130
Bloom NeighborhoodEstimated Value: $366,000 - $420,000
3
Beds
2
Baths
1,614
Sq Ft
$245/Sq Ft
Est. Value
About This Home
This home is located at 8654 Mount Union Ct NW, Lancaster, OH 43130 and is currently estimated at $396,096, approximately $245 per square foot. 8654 Mount Union Ct NW is a home located in Fairfield County with nearby schools including Bloom Carroll Primary School, Bloom Carroll Intermediate School, and Bloom-Carroll Middle School.
Ownership History
Date
Name
Owned For
Owner Type
Purchase Details
Closed on
Nov 8, 2024
Sold by
Kincaid Luke R and Kincaid Sarah R
Bought by
Reinschell Cole and Bell Marlee K
Current Estimated Value
Home Financials for this Owner
Home Financials are based on the most recent Mortgage that was taken out on this home.
Original Mortgage
$381,954
Outstanding Balance
$378,293
Interest Rate
6.32%
Mortgage Type
FHA
Estimated Equity
$17,803
Purchase Details
Closed on
Jul 28, 2021
Sold by
Cline Scarlett L
Bought by
Kincaid Luke R and Kincaid Sarah R
Home Financials for this Owner
Home Financials are based on the most recent Mortgage that was taken out on this home.
Original Mortgage
$274,500
Interest Rate
3%
Mortgage Type
New Conventional
Create a Home Valuation Report for This Property
The Home Valuation Report is an in-depth analysis detailing your home's value as well as a comparison with similar homes in the area
Home Values in the Area
Average Home Value in this Area
Purchase History
| Date | Buyer | Sale Price | Title Company |
|---|---|---|---|
| Reinschell Cole | $389,000 | None Listed On Document | |
| Reinschell Cole | $389,000 | None Listed On Document | |
| Kincaid Luke R | $300,000 | Northwest Advantage Ttl Agcy |
Source: Public Records
Mortgage History
| Date | Status | Borrower | Loan Amount |
|---|---|---|---|
| Open | Reinschell Cole | $381,954 | |
| Closed | Reinschell Cole | $381,954 | |
| Previous Owner | Kincaid Luke R | $274,500 |
Source: Public Records
Tax History Compared to Growth
Tax History
| Year | Tax Paid | Tax Assessment Tax Assessment Total Assessment is a certain percentage of the fair market value that is determined by local assessors to be the total taxable value of land and additions on the property. | Land | Improvement |
|---|---|---|---|---|
| 2024 | $6,624 | $80,390 | $11,570 | $68,820 |
| 2023 | $3,408 | $80,390 | $11,570 | $68,820 |
| 2022 | $3,211 | $75,270 | $11,570 | $63,700 |
| 2021 | $2,444 | $60,530 | $10,240 | $50,290 |
| 2020 | $2,470 | $60,530 | $10,240 | $50,290 |
| 2019 | $2,478 | $60,530 | $10,240 | $50,290 |
| 2018 | $2,098 | $44,950 | $7,570 | $37,380 |
| 2017 | $1,977 | $53,120 | $7,570 | $45,550 |
| 2016 | $1,947 | $53,120 | $7,570 | $45,550 |
| 2015 | $1,817 | $48,990 | $7,570 | $41,420 |
| 2014 | $1,743 | $48,990 | $7,570 | $41,420 |
| 2013 | $1,743 | $48,990 | $7,570 | $41,420 |
Source: Public Records
Map
Nearby Homes
- 8642 Water St
- 7835 E Ohio State Ln NW
- 9605 Royalton Rd SW
- 839 Rockmill Rd NW
- 7985 Lithopolis Rd NW
- 1975 Lamb Rd NW
- 1219 W Slate Ridge Dr
- 10 Mount Zion Rd NW
- 681 Mount Zion Rd SW
- 8485 Westfall Rd SW
- 2780 Cedar Hill Rd NW
- 11394 Cedar Creek Dr NW
- 10385 Lithopolis Rd NW
- 8416 Royalton Rd SW
- 8245 Royalton Rd SW
- 8143 Royalton Rd SW
- 8322 Benson Rd
- 5550 Westfall Rd SW
- 4180 Stone Hill Drive East NW
- 00 Duncan Rd SW
- 8641 Mount Union Ct NW
- 8668 Mount Union Ct NW
- 8547 W Bowling Green Ln NW
- 8587 W Bowling Green Ln NW
- 8635 W Bowling Green Ln NW
- 8667 W Bowling Green Ln NW
- 8623 Mount Union Ct NW
- 8493 W Bowling Green Ln NW
- 8667 Mount Union Ct NW
- 8598 W Bowling Green Ln NW
- 8530 W Ohio State Ln NW
- 8656 W Bowling Green Ln NW
- 8626 W Bowling Green Ln NW
- 8594 W Bowling Green Ln NW
- 8612 W Bowling Green Ln NW
- 8668 W Bowling Green Ln NW
- 8577 Ohio Wesleyan Ct NW
- 8541 Ohio Wesleyan Ct NW
- 8461 W Bowling Green Ln NW
- 8461 N Bowling Green Place