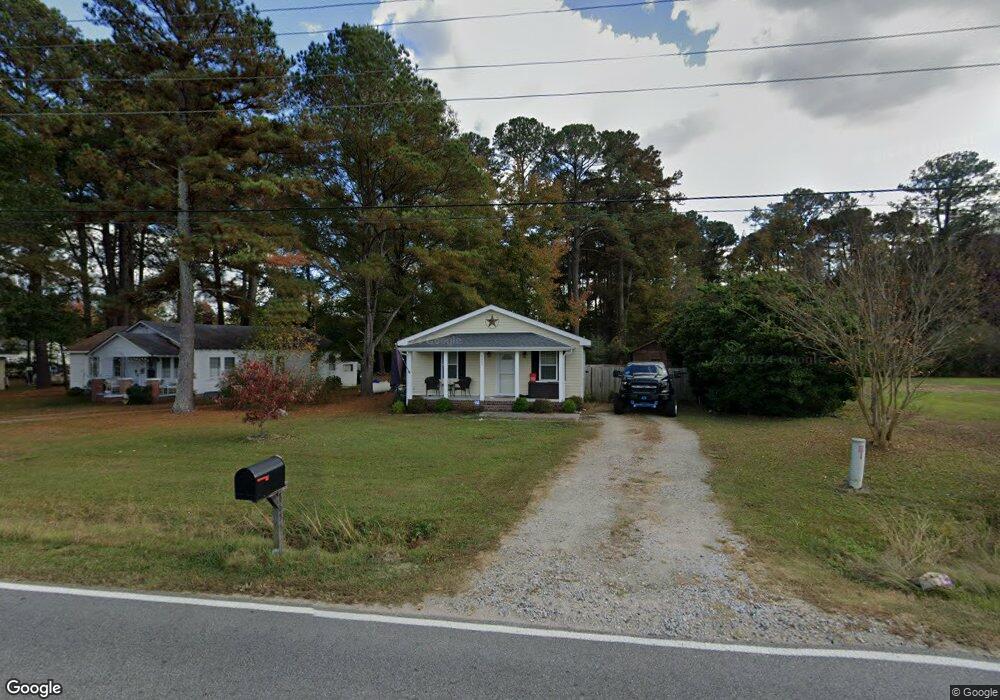
8655 Bend of the River Rd Rocky Mount, NC 27803
Estimated Value: $94,995 - $170,000
2
Beds
1
Bath
798
Sq Ft
$177/Sq Ft
Est. Value
About This Home
This home is located at 8655 Bend of the River Rd, Rocky Mount, NC 27803 and is currently estimated at $140,999, approximately $176 per square foot. 8655 Bend of the River Rd is a home located in Nash County with nearby schools including Nash Central High School, Coopers Elementary School, and Nash Central Middle School.
Ownership History
Date
Name
Owned For
Owner Type
Purchase Details
Closed on
Mar 29, 2019
Sold by
Stone Marvin Adam and Stone Leigh Anne
Bought by
Eason Brandon Clay
Current Estimated Value
Home Financials for this Owner
Home Financials are based on the most recent Mortgage that was taken out on this home.
Original Mortgage
$76,767
Outstanding Balance
$67,354
Interest Rate
4.3%
Mortgage Type
New Conventional
Estimated Equity
$73,645
Purchase Details
Closed on
Mar 31, 2014
Sold by
Mitchell Clyde Neal and Mitchell Amanda Renee
Bought by
Stone Marvin Adam
Purchase Details
Closed on
Jul 22, 2005
Sold by
Mitchell Rudolph and Mitchell Dot
Bought by
Mitchell Rudolph and Mitchell Clyde Neal
Purchase Details
Closed on
Jun 16, 2005
Sold by
Centex Home Equity Company Llc
Bought by
Mitchell Rudolph and Mitchell Dot
Purchase Details
Closed on
Oct 26, 2004
Sold by
Lamb Stephen A
Bought by
Centex Home Equity Company Llc
Create a Home Valuation Report for This Property
The Home Valuation Report is an in-depth analysis detailing your home's value as well as a comparison with similar homes in the area
Home Values in the Area
Average Home Value in this Area
Purchase History
| Date | Buyer | Sale Price | Title Company |
|---|---|---|---|
| Eason Brandon Clay | $76,000 | None Available | |
| Stone Marvin Adam | $15,000 | None Available | |
| Mitchell Rudolph | -- | None Available | |
| Mitchell Rudolph | $10,000 | None Available | |
| Centex Home Equity Company Llc | $35,500 | None Available |
Source: Public Records
Mortgage History
| Date | Status | Borrower | Loan Amount |
|---|---|---|---|
| Open | Eason Brandon Clay | $76,767 |
Source: Public Records
Tax History Compared to Growth
Tax History
| Year | Tax Paid | Tax Assessment Tax Assessment Total Assessment is a certain percentage of the fair market value that is determined by local assessors to be the total taxable value of land and additions on the property. | Land | Improvement |
|---|---|---|---|---|
| 2025 | $490 | $44,060 | $23,170 | $20,890 |
| 2024 | $473 | $40,900 | $23,170 | $17,730 |
| 2023 | $467 | $40,900 | $0 | $0 |
| 2022 | $467 | $40,900 | $23,170 | $17,730 |
| 2021 | $467 | $40,900 | $23,170 | $17,730 |
| 2020 | $468 | $40,900 | $23,170 | $17,730 |
| 2019 | $452 | $40,900 | $23,170 | $17,730 |
| 2018 | $440 | $40,900 | $0 | $0 |
| 2017 | $440 | $40,900 | $0 | $0 |
| 2015 | $317 | $24,930 | $0 | $0 |
| 2014 | $282 | $24,930 | $0 | $0 |
Source: Public Records
Map
Nearby Homes
- 10226 N Carolina 97
- BELHAVEN - EXPRESS Plan at Bentridge
- 7461 Michelle Rd
- 7475 Michelle Rd
- 7507 Michelle Rd
- 7352 Michelle Rd
- 7554 Michelle Rd
- 7530 Michelle Rd
- 7456 Michelle Rd
- 5494 Tar Island Dr
- 7455 Jessica Way Unit 76
- 7616 Jessica Way Unit 52
- 7513 Sarah Way Unit 75
- 7580 Jessica Way Unit 50
- 7526 Jessica Way Unit 47
- 7303 River Glenn Rd
- 6000 Haywood Dr
- 8671 Bend of the River Rd
- 8695 Bend of the River Rd
- 8701 Bend of the River Rd
- 8684 Bend of the River Rd
- 8547 Bend of the River Rd
- 8720 Bend of the River Rd
- 5321 Ryland Ln
- 8513 Bend of the River Rd
- 8719 Bend of the River Rd
- 5355 Ryland Ln
- 8756 Bend of the River Rd
- 8492 Bend of the River Rd
- 5174 Oak Leaf Ln
- 8472 Bend of the River Rd
- 8740 Bend of the River Rd
- 8805 Bend of the River Rd
- 8452 Bend of the River Rd
- 8849 Bend of the River Rd
- 6474 River Walk Dr
- 8427 Bend of the River Rd