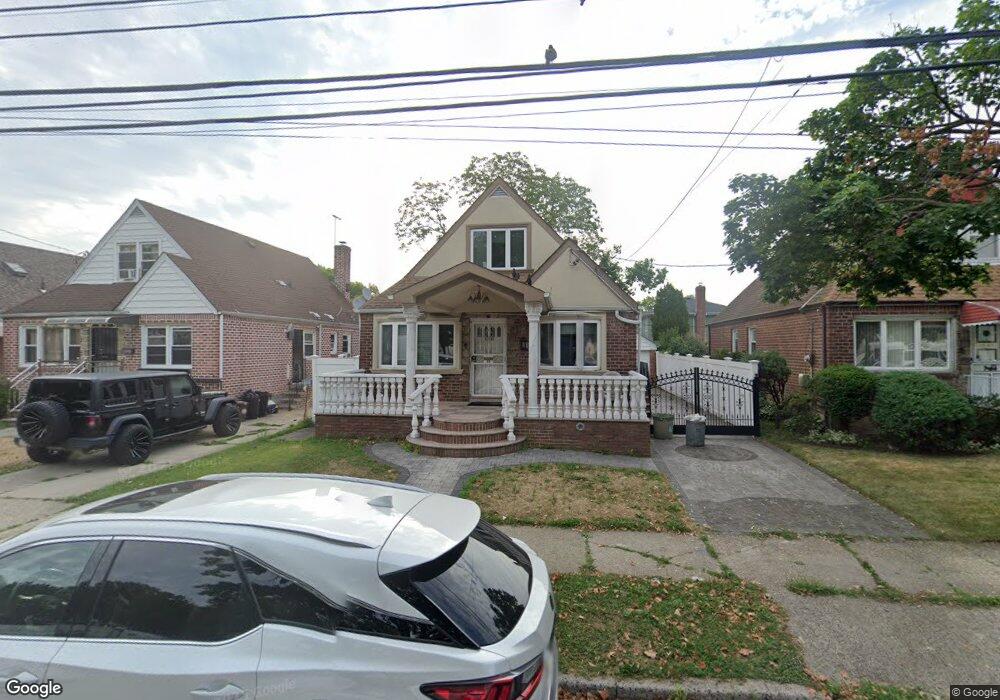
8655 Winchester Blvd Queens Village, NY 11427
Bellerose NeighborhoodEstimated Value: $724,241 - $860,000
--
Bed
--
Bath
1,240
Sq Ft
$664/Sq Ft
Est. Value
About This Home
This home is located at 8655 Winchester Blvd, Queens Village, NY 11427 and is currently estimated at $823,310, approximately $663 per square foot. 8655 Winchester Blvd is a home located in Queens County with nearby schools including P.S. 18 Q The Winchester School, Irwin Altman Middle School 172, and Martin Van Buren High School.
Ownership History
Date
Name
Owned For
Owner Type
Purchase Details
Closed on
Dec 2, 2021
Sold by
Gogna Suman
Bought by
Gogna Suman and Kumar Gogna Naresh
Current Estimated Value
Purchase Details
Closed on
Aug 11, 2009
Sold by
Gogna Naresh and Gogna Suman
Bought by
Gogna Suman
Home Financials for this Owner
Home Financials are based on the most recent Mortgage that was taken out on this home.
Original Mortgage
$7,604
Outstanding Balance
$4,948
Interest Rate
5.17%
Mortgage Type
Purchase Money Mortgage
Estimated Equity
$818,362
Purchase Details
Closed on
Jul 22, 2002
Sold by
Sullivan James T and Duffy Thomas J
Bought by
Gogna Naresh and Gogna Suman
Purchase Details
Closed on
Jan 2, 2002
Sold by
Sullivan James T and Sullivan James T
Bought by
Sullivan James T and Duffy Thomas J
Purchase Details
Closed on
Oct 2, 1997
Sold by
Wydra Antoinette
Bought by
Sullivan Ann Dorothy and Duffy Thomas J
Create a Home Valuation Report for This Property
The Home Valuation Report is an in-depth analysis detailing your home's value as well as a comparison with similar homes in the area
Home Values in the Area
Average Home Value in this Area
Purchase History
| Date | Buyer | Sale Price | Title Company |
|---|---|---|---|
| Gogna Suman | -- | -- | |
| Gogna Suman | -- | -- | |
| Gogna Naresh | -- | -- | |
| Sullivan James T | -- | -- | |
| Sullivan Ann Dorothy | -- | Lawyers Title Insurance Corp |
Source: Public Records
Mortgage History
| Date | Status | Borrower | Loan Amount |
|---|---|---|---|
| Open | Gogna Suman | $7,604 |
Source: Public Records
Tax History Compared to Growth
Tax History
| Year | Tax Paid | Tax Assessment Tax Assessment Total Assessment is a certain percentage of the fair market value that is determined by local assessors to be the total taxable value of land and additions on the property. | Land | Improvement |
|---|---|---|---|---|
| 2025 | $7,061 | $35,424 | $11,856 | $23,568 |
| 2024 | $7,061 | $35,158 | $12,012 | $23,146 |
| 2023 | $6,662 | $33,168 | $11,656 | $21,512 |
| 2022 | $5,928 | $42,720 | $14,760 | $27,960 |
| 2021 | $6,212 | $40,680 | $14,760 | $25,920 |
| 2020 | $6,249 | $38,220 | $14,760 | $23,460 |
| 2019 | $6,129 | $40,800 | $14,760 | $26,040 |
| 2018 | $5,634 | $27,640 | $11,276 | $16,364 |
| 2017 | $5,316 | $26,076 | $14,350 | $11,726 |
| 2016 | $4,918 | $26,076 | $14,350 | $11,726 |
| 2015 | $3,586 | $27,840 | $16,380 | $11,460 |
| 2014 | $3,586 | $26,956 | $15,331 | $11,625 |
Source: Public Records
Map
Nearby Homes
- 233-16 87th Ave
- 86-21 233rd St
- 231-22 87th Ave
- 82-159 Country Pointe Cir
- 88-29 Winchester Blvd
- 23026 87th Ave
- 23009 87th Ave
- 229-15 87th Ave Unit 454
- 229-17 87th Ave Unit LOWER
- 229-17 87th Ave
- 86-06 231st St
- 86-06 231st St Unit Upper
- 229-20 Hillside Ave Unit 50-11
- 222-89 Braddock Ave Unit 4B
- 222-89 Braddock Ave Unit 2-E
- 222-89 Braddock Ave Unit 5A
- 222-89 Braddock Ave Unit 6-D
- 22289 Braddock Ave Unit 1G
- 82-39 232nd St
- 8922 Moline St
- 86-55 Winchester Blvd
- 8651 Winchester Blvd
- 8659 Winchester Blvd
- 8651 Winchester Blvd
- 8651 Winchester Blvd
- 8647 Winchester Blvd
- 8663 Winchester Blvd
- 86-63 Winchester Blvd Unit 1
- 8656 Musket St
- 86-56 Musket St
- 8656 Musket St
- 8660 Musket St
- 8652 Musket St
- 8660 Musket St
- 8669 Winchester Blvd
- 8643 Winchester Blvd
- 8664 Musket St
- 8648 Musket St
- 8664 Musket St
- 8664 Musket St