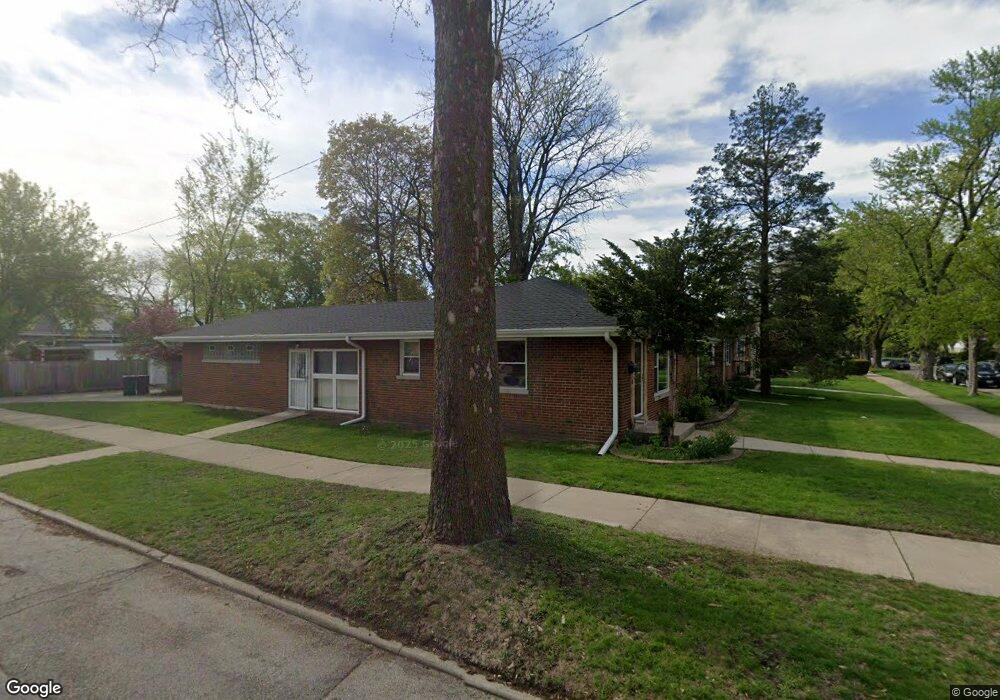
8657 Avers Ave Skokie, IL 60076
North Skokie NeighborhoodEstimated Value: $430,000 - $543,000
4
Beds
3
Baths
1,450
Sq Ft
$329/Sq Ft
Est. Value
About This Home
This home is located at 8657 Avers Ave, Skokie, IL 60076 and is currently estimated at $476,570, approximately $328 per square foot. 8657 Avers Ave is a home located in Cook County with nearby schools including Walker Elementary School, Chute Middle School, and Evanston Township High School.
Ownership History
Date
Name
Owned For
Owner Type
Purchase Details
Closed on
May 4, 2023
Sold by
Alzerijawi Alaa and Alzerijawi Nooria
Bought by
Safdary Nooria
Current Estimated Value
Purchase Details
Closed on
Nov 8, 2018
Sold by
Alzerijawi Alaa
Bought by
Alzerijawi Alaa and Safdary Nooria
Purchase Details
Closed on
Jan 16, 2008
Sold by
Alzerijawi Alaa and Safdary Nooria
Bought by
Alzerijawi Alaa
Home Financials for this Owner
Home Financials are based on the most recent Mortgage that was taken out on this home.
Original Mortgage
$254,000
Interest Rate
5.87%
Mortgage Type
New Conventional
Purchase Details
Closed on
Jun 7, 2007
Sold by
Skyer Harold
Bought by
Alzerijawi Alaa and Safdary Nooria
Home Financials for this Owner
Home Financials are based on the most recent Mortgage that was taken out on this home.
Original Mortgage
$266,000
Interest Rate
10.28%
Mortgage Type
New Conventional
Purchase Details
Closed on
Sep 25, 1998
Sold by
Skyer Harold and Skyer Shirley S
Bought by
Skyer Harold and Skyer Shirley S
Create a Home Valuation Report for This Property
The Home Valuation Report is an in-depth analysis detailing your home's value as well as a comparison with similar homes in the area
Home Values in the Area
Average Home Value in this Area
Purchase History
| Date | Buyer | Sale Price | Title Company |
|---|---|---|---|
| Safdary Nooria | -- | None Listed On Document | |
| Alzerijawi Alaa | -- | Attorney | |
| Alzerijawi Alaa | -- | Cambridge Title Company | |
| Alzerijawi Alaa | -- | Cambridge Title Company | |
| Alzerijawi Alaa | $332,500 | First American Title Co | |
| Skyer Harold | -- | -- |
Source: Public Records
Mortgage History
| Date | Status | Borrower | Loan Amount |
|---|---|---|---|
| Previous Owner | Alzerijawi Alaa | $254,000 | |
| Previous Owner | Alzerijawi Alaa | $266,000 |
Source: Public Records
Tax History Compared to Growth
Tax History
| Year | Tax Paid | Tax Assessment Tax Assessment Total Assessment is a certain percentage of the fair market value that is determined by local assessors to be the total taxable value of land and additions on the property. | Land | Improvement |
|---|---|---|---|---|
| 2024 | $8,112 | $37,419 | $9,431 | $27,988 |
| 2023 | $7,763 | $37,419 | $9,431 | $27,988 |
| 2022 | $7,763 | $37,419 | $9,431 | $27,988 |
| 2021 | $5,657 | $25,018 | $6,636 | $18,382 |
| 2020 | $5,627 | $25,018 | $6,636 | $18,382 |
| 2019 | $5,618 | $27,798 | $6,636 | $21,162 |
| 2018 | $5,609 | $24,167 | $5,763 | $18,404 |
| 2017 | $5,498 | $24,167 | $5,763 | $18,404 |
| 2016 | $5,431 | $24,167 | $5,763 | $18,404 |
| 2015 | $5,009 | $21,540 | $4,890 | $16,650 |
| 2014 | $4,969 | $21,540 | $4,890 | $16,650 |
| 2013 | $4,897 | $21,540 | $4,890 | $16,650 |
Source: Public Records
Map
Nearby Homes
- 8600 E Prairie Rd
- 3639 Crain St
- 3615 Oakton St
- 3358 Dempster St
- 8451 Harding Ave
- 8720 Karlov Ave
- 40 Williamsburg Rd
- 8417 Harding Ave
- 16 Williamsburg Ct
- 8822 Central Park Ave
- 8713 Drake Ave
- 8450 Drake Ave
- 8330 Springfield Ave
- 8449 Kedvale Ave
- 8728 Trumbull Ave
- 8613 Trumbull Ave
- 3457 Main St
- 8231 Harding Ave
- 3453 Main St
- 8301 Karlov Ave
- 8649 Avers Ave
- 8649 Avers Ave
- 8647 Avers Ave
- 8701 Avers Ave
- 8658 Hamlin Ave
- 8641 Avers Ave
- 8648 Hamlin Ave
- 8707 Avers Ave
- 8700 Hamlin Ave
- 8642 Hamlin Ave
- 8637 Avers Ave
- 8656 Avers Ave
- 8650 Avers Ave
- 8711 Avers Ave
- 8640 Hamlin Ave
- 8640 Hamlin Ave
- 8704 Hamlin Ave
- 8700 Avers Ave
- 8646 Avers Ave
- 8635 Avers Ave