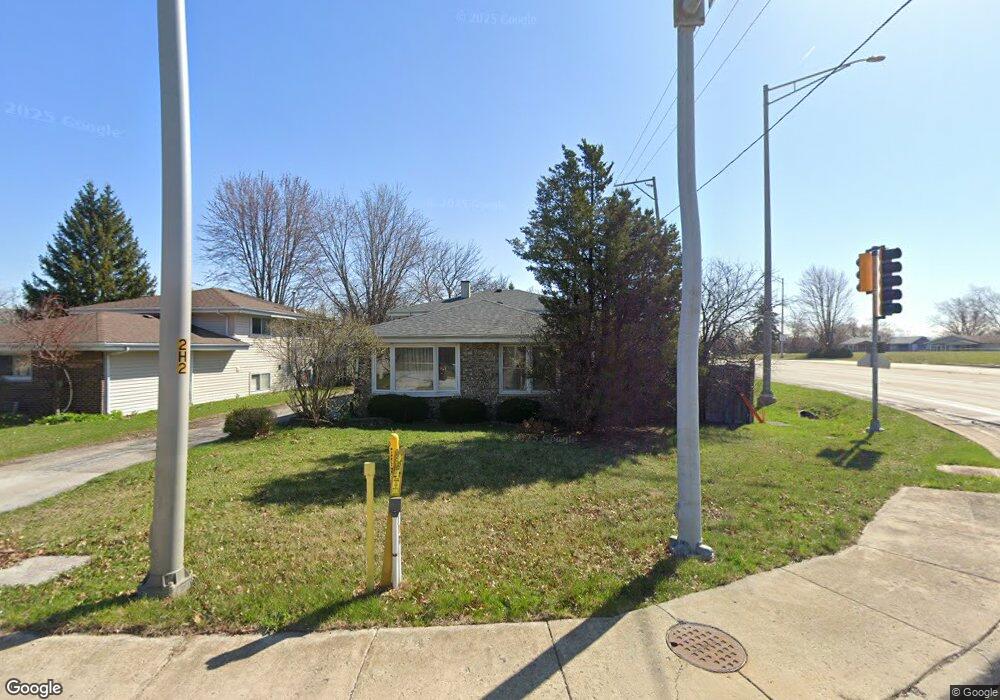
8657 S Kean Ave Hickory Hills, IL 60457
Estimated Value: $349,887 - $390,000
3
Beds
2
Baths
1,230
Sq Ft
$299/Sq Ft
Est. Value
About This Home
This home is located at 8657 S Kean Ave, Hickory Hills, IL 60457 and is currently estimated at $368,222, approximately $299 per square foot. 8657 S Kean Ave is a home located in Cook County with nearby schools including Frank A Brodnicki Elementary School, Argo Community High School, and St. Patricia School.
Ownership History
Date
Name
Owned For
Owner Type
Purchase Details
Closed on
Oct 13, 2005
Sold by
Barakat John
Bought by
Salameh Aid and Saafin Nazek M
Current Estimated Value
Home Financials for this Owner
Home Financials are based on the most recent Mortgage that was taken out on this home.
Original Mortgage
$225,000
Outstanding Balance
$122,095
Interest Rate
5.98%
Mortgage Type
Unknown
Estimated Equity
$246,127
Purchase Details
Closed on
Mar 28, 2003
Sold by
Said Ismail A
Bought by
Barakat John
Home Financials for this Owner
Home Financials are based on the most recent Mortgage that was taken out on this home.
Original Mortgage
$120,000
Interest Rate
5.87%
Purchase Details
Closed on
Sep 29, 1995
Sold by
Costello Robert J and Costello Shirley R
Bought by
Said Ismail A
Home Financials for this Owner
Home Financials are based on the most recent Mortgage that was taken out on this home.
Original Mortgage
$110,000
Interest Rate
7.91%
Create a Home Valuation Report for This Property
The Home Valuation Report is an in-depth analysis detailing your home's value as well as a comparison with similar homes in the area
Home Values in the Area
Average Home Value in this Area
Purchase History
| Date | Buyer | Sale Price | Title Company |
|---|---|---|---|
| Salameh Aid | $265,000 | Pntn | |
| Barakat John | $210,000 | Git | |
| Said Ismail A | $120,000 | -- |
Source: Public Records
Mortgage History
| Date | Status | Borrower | Loan Amount |
|---|---|---|---|
| Open | Salameh Aid | $225,000 | |
| Previous Owner | Barakat John | $120,000 | |
| Previous Owner | Said Ismail A | $110,000 |
Source: Public Records
Tax History Compared to Growth
Tax History
| Year | Tax Paid | Tax Assessment Tax Assessment Total Assessment is a certain percentage of the fair market value that is determined by local assessors to be the total taxable value of land and additions on the property. | Land | Improvement |
|---|---|---|---|---|
| 2024 | $7,907 | $26,337 | $5,795 | $20,542 |
| 2023 | $6,767 | $28,000 | $5,795 | $22,205 |
| 2022 | $6,767 | $21,369 | $4,967 | $16,402 |
| 2021 | $6,359 | $21,368 | $4,967 | $16,401 |
| 2020 | $6,189 | $21,368 | $4,967 | $16,401 |
| 2019 | $6,420 | $20,911 | $4,415 | $16,496 |
| 2018 | $6,123 | $20,911 | $4,415 | $16,496 |
| 2017 | $6,095 | $20,911 | $4,415 | $16,496 |
| 2016 | $5,991 | $18,724 | $3,863 | $14,861 |
| 2015 | $5,791 | $18,724 | $3,863 | $14,861 |
| 2014 | $5,720 | $18,724 | $3,863 | $14,861 |
| 2013 | $4,992 | $17,921 | $3,863 | $14,058 |
Source: Public Records
Map
Nearby Homes
- 9141 Meadowview Dr
- 8701 S Kean Ave
- 8601 S Kean Ave
- Lot 8 S Kean Ave
- Lot 7 S Kean Ave
- Lot 6 S Kean Ave
- Lot 5 S Kean Ave
- Lot 4 S Kean Ave
- Lot 3 S Kean Ave
- Lot 2 S Kean Ave
- Lot 1 S Kean Ave
- 9049 Barberry Ln
- 9140 Sycamore Dr
- 9101 Sycamore Dr
- 8948 Barberry Ln
- 9012 W 89th St
- 8832 Pleasant Ave
- 8232 Concord Ln Unit 6B720
- 9013 W 91st Place
- 8810 W 83rd Place
- 9151 Meadowview Dr
- 8645 S Kean Ave
- 9161 Meadowview Dr
- 9131 Meadowview Dr
- 9121 Meadowview Dr
- 9171 Meadowview Dr
- 8637 S Kean Ave
- 9140 Meadowview Dr
- 9150 Meadowview Dr
- 9111 Meadowview Dr
- 9130 Meadowview Dr
- 9160 Meadowview Dr
- 9126 Barberry Ln
- 9122 Barberry Ln
- 9130 Barberry Ln
- 9170 Meadowview Dr
- 9120 Meadowview Dr
- 9118 Barberry Ln
- 9101 Meadowview Dr
- 9134 Barberry Ln