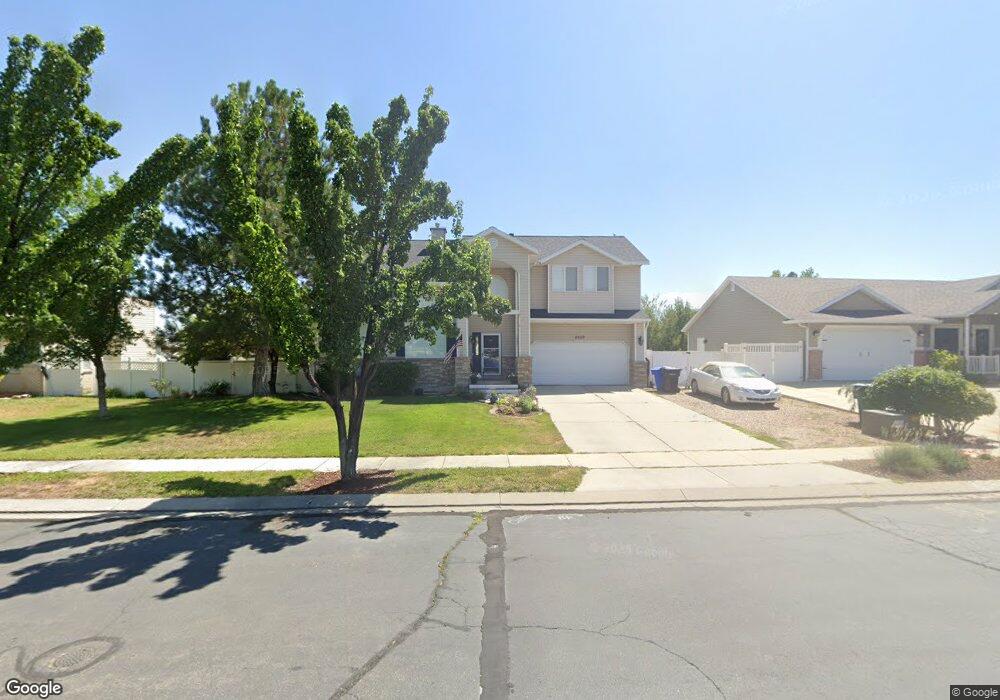
8659 Pebblecreek Rd West Jordan, UT 84081
Copper Hills NeighborhoodEstimated Value: $566,000 - $633,000
5
Beds
4
Baths
1,998
Sq Ft
$301/Sq Ft
Est. Value
About This Home
This home is located at 8659 Pebblecreek Rd, West Jordan, UT 84081 and is currently estimated at $600,478, approximately $300 per square foot. 8659 Pebblecreek Rd is a home located in Salt Lake County with nearby schools including Jordan Hills Elementary School, West Hills Middle School, and Copper Hills High School.
Ownership History
Date
Name
Owned For
Owner Type
Purchase Details
Closed on
Sep 24, 2021
Sold by
Santiago Sergio
Bought by
Black Rebekah Bernice and Black Jeremy L
Current Estimated Value
Home Financials for this Owner
Home Financials are based on the most recent Mortgage that was taken out on this home.
Original Mortgage
$424,000
Outstanding Balance
$385,808
Interest Rate
2.8%
Mortgage Type
FHA
Estimated Equity
$214,670
Purchase Details
Closed on
Jan 5, 2007
Sold by
Smoyer John H and Smoyer Catherine B
Bought by
Santiago Sergio
Home Financials for this Owner
Home Financials are based on the most recent Mortgage that was taken out on this home.
Original Mortgage
$240,000
Interest Rate
6.29%
Mortgage Type
Purchase Money Mortgage
Purchase Details
Closed on
Sep 29, 1997
Sold by
Alpine Homes Inc
Bought by
Smoyer John H and Smoyer Catherine B
Home Financials for this Owner
Home Financials are based on the most recent Mortgage that was taken out on this home.
Original Mortgage
$161,450
Interest Rate
7.54%
Create a Home Valuation Report for This Property
The Home Valuation Report is an in-depth analysis detailing your home's value as well as a comparison with similar homes in the area
Home Values in the Area
Average Home Value in this Area
Purchase History
| Date | Buyer | Sale Price | Title Company |
|---|---|---|---|
| Black Rebekah Bernice | -- | Vanguard Title Union Park | |
| Santiago Sergio | -- | Surety Title | |
| Smoyer John H | -- | -- |
Source: Public Records
Mortgage History
| Date | Status | Borrower | Loan Amount |
|---|---|---|---|
| Open | Black Rebekah Bernice | $424,000 | |
| Previous Owner | Santiago Sergio | $240,000 | |
| Previous Owner | Smoyer John H | $161,450 |
Source: Public Records
Tax History Compared to Growth
Tax History
| Year | Tax Paid | Tax Assessment Tax Assessment Total Assessment is a certain percentage of the fair market value that is determined by local assessors to be the total taxable value of land and additions on the property. | Land | Improvement |
|---|---|---|---|---|
| 2025 | $2,860 | $553,100 | $169,300 | $383,800 |
| 2024 | $2,860 | $550,200 | $167,600 | $382,600 |
| 2023 | $2,883 | $522,800 | $158,100 | $364,700 |
| 2022 | $2,984 | $532,400 | $155,000 | $377,400 |
| 2021 | $2,503 | $406,500 | $120,500 | $286,000 |
| 2020 | $2,348 | $357,800 | $120,500 | $237,300 |
| 2019 | $2,317 | $346,200 | $113,700 | $232,500 |
| 2018 | $2,191 | $324,700 | $113,700 | $211,000 |
| 2017 | $2,021 | $298,200 | $113,700 | $184,500 |
| 2016 | $1,964 | $272,300 | $113,700 | $158,600 |
| 2015 | $1,831 | $247,600 | $120,200 | $127,400 |
| 2014 | $1,681 | $223,800 | $110,500 | $113,300 |
Source: Public Records
Map
Nearby Homes
- 8577 Autumn Gold Cir
- 4887 W 8620 S
- 8441 S Spratling Dr
- 8854 Rocky Creek Dr
- 8322 Copper Vista Cir
- 5098 Cherry Laurel Ln
- 8453 S Windmill Dr
- 7903 Mckenzie Ln
- 7886 Mckenzie Ln
- 8767 S Brown Park Dr
- 9118 S Wisteria Way
- 4624 Pine Crossing Dr
- 5582 Washoe Cove
- 9182 Wisteria Way
- 8359 Etude Dr
- 4904 Wild Acres Dr
- 5422 W Island Creek Dr
- 9332 S Wild Clover Ln
- 5298 W Icehouse Way
- 4707 W Granada Hills Ct
- 8659 S Pebblecreek Rd
- 8645 Pebblecreek Rd
- 8675 Pebblecreek Rd
- 8644 S Mcginnis Ln
- 8644 Mcginnis Ln
- 8658 S Mcginnis Ln
- 8658 Mcginnis Ln
- 5087 Pebblerock Cir
- 5087 W Pebblerock Cir
- 8689 Pebblecreek Rd
- 8689 S Pebblecreek Rd
- 8633 Pebblecreek Rd
- 5094 W Pebblerock Cir Unit 201
- 5094 W Pebblerock Cir
- 8632 Mcginnis Ln
- 8632 S Mcginnis Ln
- 8672 Mcginnis Ln
- 8672 S Mcginnis Ln
- 5082 Pebblestone Cir
- 5091 W 8620 S