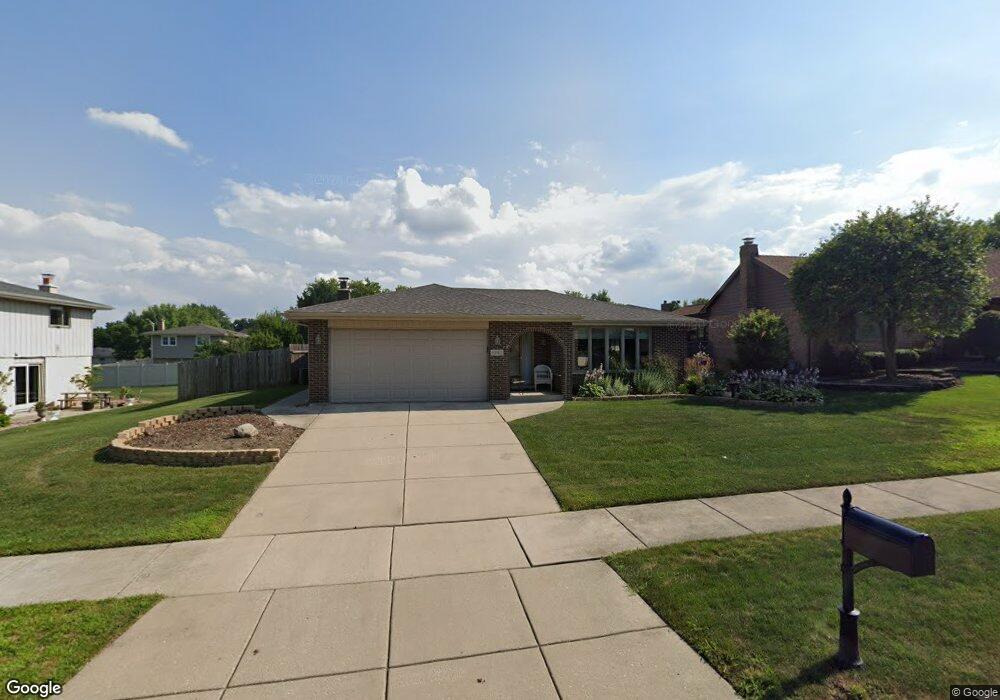
8659 W 142nd St Unit 1 Orland Park, IL 60462
Silver Lake North NeighborhoodEstimated Value: $747,000 - $922,000
4
Beds
4
Baths
3,600
Sq Ft
$223/Sq Ft
Est. Value
About This Home
This home is located at 8659 W 142nd St Unit 1, Orland Park, IL 60462 and is currently estimated at $803,759, approximately $223 per square foot. 8659 W 142nd St Unit 1 is a home located in Cook County with nearby schools including Prairie Elementary School, Liberty Elementary School, and Jerling Junior High School.
Ownership History
Date
Name
Owned For
Owner Type
Purchase Details
Closed on
Mar 26, 2015
Sold by
Bernhardt Albert H and Bernhardt Catherine M
Bought by
Bernhardt Family Trust
Current Estimated Value
Purchase Details
Closed on
Jul 8, 2011
Sold by
Malburg Cory and Malburg Stacy L
Bought by
Bernhardt Albert T and Bernhardt Catherine M
Home Financials for this Owner
Home Financials are based on the most recent Mortgage that was taken out on this home.
Original Mortgage
$70,000
Outstanding Balance
$5,292
Interest Rate
4.64%
Mortgage Type
New Conventional
Estimated Equity
$798,467
Purchase Details
Closed on
Aug 13, 2007
Sold by
Cannatello Rosario H
Bought by
Vogel Stacy L
Purchase Details
Closed on
Feb 25, 2004
Sold by
Kbl Enterprises Inc
Bought by
Vogel Stacy L and Cannatello Rosario H
Home Financials for this Owner
Home Financials are based on the most recent Mortgage that was taken out on this home.
Original Mortgage
$100,000
Interest Rate
5.78%
Mortgage Type
Unknown
Create a Home Valuation Report for This Property
The Home Valuation Report is an in-depth analysis detailing your home's value as well as a comparison with similar homes in the area
Home Values in the Area
Average Home Value in this Area
Purchase History
| Date | Buyer | Sale Price | Title Company |
|---|---|---|---|
| Bernhardt Family Trust | -- | None Available | |
| Bernhardt Albert T | $520,000 | Pntn | |
| Vogel Stacy L | -- | None Available | |
| Vogel Stacy L | $555,000 | Chicago Title Insurance Comp |
Source: Public Records
Mortgage History
| Date | Status | Borrower | Loan Amount |
|---|---|---|---|
| Open | Bernhardt Albert T | $70,000 | |
| Previous Owner | Vogel Stacy L | $100,000 |
Source: Public Records
Tax History Compared to Growth
Tax History
| Year | Tax Paid | Tax Assessment Tax Assessment Total Assessment is a certain percentage of the fair market value that is determined by local assessors to be the total taxable value of land and additions on the property. | Land | Improvement |
|---|---|---|---|---|
| 2024 | $15,938 | $67,000 | $11,556 | $55,444 |
| 2023 | $12,052 | $67,000 | $11,556 | $55,444 |
| 2022 | $12,052 | $43,653 | $10,015 | $33,638 |
| 2021 | $11,665 | $43,652 | $10,015 | $33,637 |
| 2020 | $11,292 | $43,652 | $10,015 | $33,637 |
| 2019 | $11,098 | $43,863 | $9,244 | $34,619 |
| 2018 | $11,642 | $47,046 | $9,244 | $37,802 |
| 2017 | $11,395 | $47,046 | $9,244 | $37,802 |
| 2016 | $12,150 | $46,040 | $8,474 | $37,566 |
| 2015 | $11,998 | $46,040 | $8,474 | $37,566 |
| 2014 | $11,835 | $46,040 | $8,474 | $37,566 |
| 2013 | $12,139 | $49,990 | $8,474 | $41,516 |
Source: Public Records
Map
Nearby Homes
- 8700 Berkley Ct
- 14040 Boxwood Ln
- 14345 S 87th Ave
- 14111 Tod William Dr
- 14034 S 84th Ave
- 8820 W 140th St Unit 2A
- 8810 Clearview Dr Unit 8810
- 14216 Clearview Dr
- 14453 S 88th Ave
- 14508 Maycliff Dr
- 14304 Clearview Ct Unit 8904
- 8932 Pebble Beach Ln
- 14023 Chelsea Dr
- 14402 S 90th Ct Unit 1A
- 14340 Mason Ln
- 8134 Uxbridge Dr
- 14350 Mason Ln
- 9114 W 140th St Unit 204
- 14320 S 81st Ct
- 14712 S 88th Ave
- 8651 W 142nd St
- 8658 W 142nd Place
- 8650 W 142nd Place
- 14210 S 87th Ave
- 14161 S 87th Ave
- 8643 W 142nd St
- 14220 S 87th Ave
- 14200 S 87th Ave
- 8642 W 142nd Place
- 14230 S 87th Ave
- 14158 S 86th Place
- 14160 S 87th Ave
- 14151 S 87th Ave
- 8634 W 142nd Place
- 14211 S 87th Place Unit 1
- 14221 S 87th Place
- 14150 S 86th Place
- 8659 W 142nd Place
- 14201 S 87th Place
- 8651 W 142nd Place