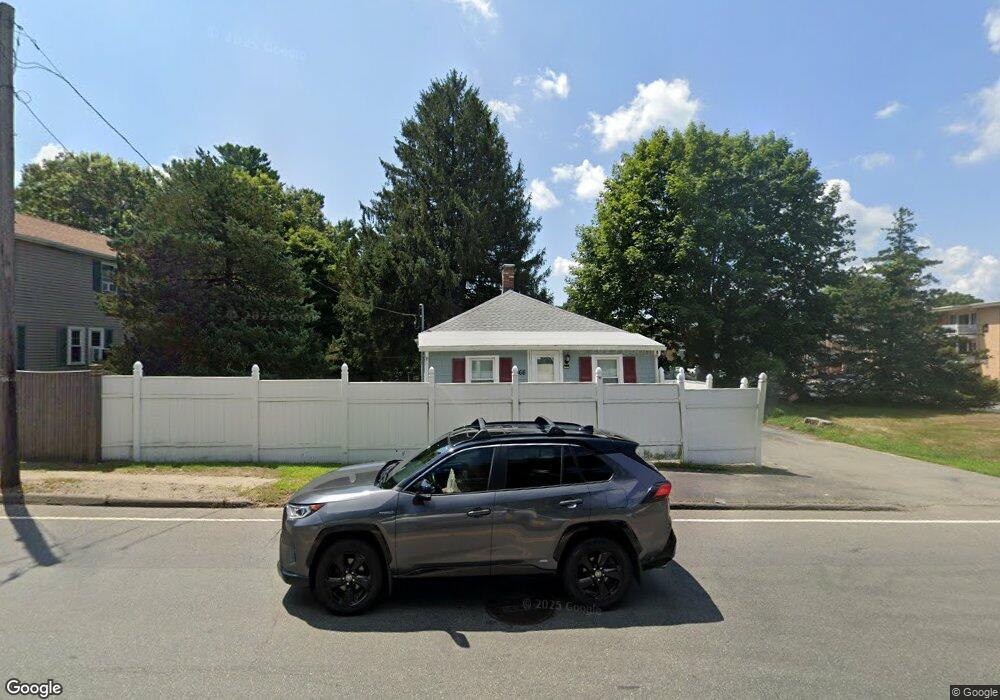
866 Central St Stoughton, MA 02072
Estimated Value: $471,000 - $554,000
3
Beds
2
Baths
1,148
Sq Ft
$444/Sq Ft
Est. Value
About This Home
This home is located at 866 Central St, Stoughton, MA 02072 and is currently estimated at $510,073, approximately $444 per square foot. 866 Central St is a home located in Norfolk County with nearby schools including Joseph R Dawe Jr Elementary School, Dr. Robert G. O'Donnell Middle School, and Stoughton High School.
Ownership History
Date
Name
Owned For
Owner Type
Purchase Details
Closed on
Sep 28, 2017
Sold by
Ma Anh K
Bought by
Ta Katie T
Current Estimated Value
Home Financials for this Owner
Home Financials are based on the most recent Mortgage that was taken out on this home.
Original Mortgage
$216,000
Outstanding Balance
$179,894
Interest Rate
3.89%
Mortgage Type
New Conventional
Estimated Equity
$330,179
Purchase Details
Closed on
Jun 28, 2010
Sold by
Hazelton Dawn K
Bought by
Nguyen John H
Purchase Details
Closed on
May 27, 2005
Sold by
Daphnis Emmanuel J and Salomon Fredlyne
Bought by
Hazelton Dawn K
Purchase Details
Closed on
May 27, 2003
Sold by
Chowdhury Tapan
Bought by
Saphnis Emmanuel J and Salomon Fredlyne
Purchase Details
Closed on
Oct 4, 2002
Sold by
Higgins Mark J Est and Wells Fargo Bk Minn Na
Bought by
Chowdhury Tapan
Purchase Details
Closed on
Dec 4, 1995
Sold by
Hopkins William E and Hopkins Nadine J
Bought by
Higgins Mark J and Higgins Joann J
Create a Home Valuation Report for This Property
The Home Valuation Report is an in-depth analysis detailing your home's value as well as a comparison with similar homes in the area
Home Values in the Area
Average Home Value in this Area
Purchase History
| Date | Buyer | Sale Price | Title Company |
|---|---|---|---|
| Ta Katie T | $270,000 | -- | |
| Ta Katie T | $270,000 | -- | |
| Ta Katie T | $270,000 | -- | |
| Nguyen John H | $142,000 | -- | |
| Nguyen John H | $142,000 | -- | |
| Hazelton Dawn K | $254,000 | -- | |
| Hazelton Dawn K | $254,000 | -- | |
| Saphnis Emmanuel J | $192,500 | -- | |
| Saphnis Emmanuel J | $192,500 | -- | |
| Chowdhury Tapan | $137,500 | -- | |
| Chowdhury Tapan | $137,500 | -- | |
| Higgins Mark J | $75,000 | -- | |
| Higgins Mark J | $75,000 | -- |
Source: Public Records
Mortgage History
| Date | Status | Borrower | Loan Amount |
|---|---|---|---|
| Open | Ta Katie T | $216,000 | |
| Closed | Ta Katie T | $216,000 |
Source: Public Records
Tax History Compared to Growth
Tax History
| Year | Tax Paid | Tax Assessment Tax Assessment Total Assessment is a certain percentage of the fair market value that is determined by local assessors to be the total taxable value of land and additions on the property. | Land | Improvement |
|---|---|---|---|---|
| 2025 | $4,595 | $371,200 | $187,100 | $184,100 |
| 2024 | $4,440 | $348,800 | $171,000 | $177,800 |
| 2023 | $4,336 | $320,000 | $158,100 | $161,900 |
| 2022 | $4,176 | $289,800 | $145,200 | $144,600 |
| 2021 | $3,935 | $260,600 | $124,200 | $136,400 |
| 2020 | $3,776 | $253,600 | $119,400 | $134,200 |
| 2019 | $3,866 | $252,000 | $119,400 | $132,600 |
| 2018 | $3,214 | $217,000 | $112,900 | $104,100 |
| 2017 | $2,941 | $203,000 | $101,600 | $101,400 |
| 2016 | $2,921 | $195,100 | $100,000 | $95,100 |
| 2015 | $2,640 | $174,500 | $90,300 | $84,200 |
| 2014 | $2,495 | $158,500 | $83,900 | $74,600 |
Source: Public Records
Map
Nearby Homes
- 102 Ewing Dr
- 120 Charles Ave
- 316 Pleasant St
- 32 Johnson Rd
- 121 Bassick Cir
- 6 Grove St
- 229 Stoughton St
- 28 Faxon St Unit 4
- 26 Faxon St Unit 2
- 32 Doty Dr
- 362 Lincoln St
- 163 Pearl St
- 15 Lawler Ln
- 11 Monk St
- 25 Lawler Ln
- 84 Pearl St
- 30 Porter St
- 0 Washington St Unit 72888098
- 0 Washington St Unit 71897113
- 42 Amherst Rd