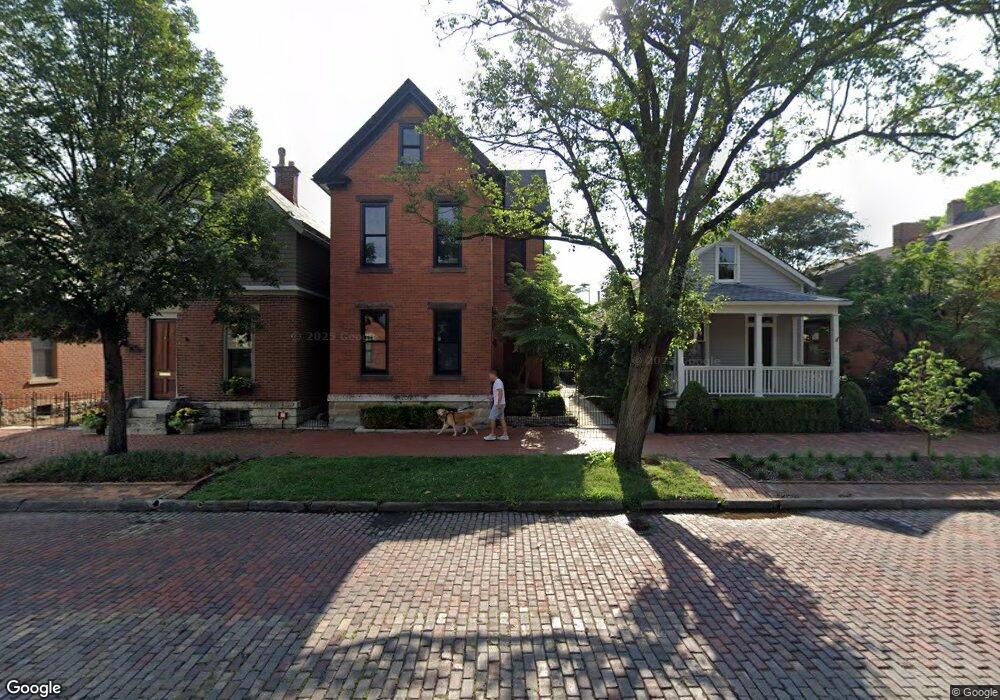
866 Mohawk St Columbus, OH 43206
German Village NeighborhoodEstimated Value: $636,460 - $713,000
3
Beds
2
Baths
1,752
Sq Ft
$382/Sq Ft
Est. Value
About This Home
This home is located at 866 Mohawk St, Columbus, OH 43206 and is currently estimated at $669,865, approximately $382 per square foot. 866 Mohawk St is a home located in Franklin County with nearby schools including Siebert Elementary School, South High School, and South Columbus Preparatory Academy.
Ownership History
Date
Name
Owned For
Owner Type
Purchase Details
Closed on
Jan 3, 2024
Sold by
Murphy Daniel R
Bought by
Murphy Claire V
Current Estimated Value
Purchase Details
Closed on
Jun 30, 2009
Sold by
Petro John P and Petro Angela S
Bought by
Murphy Claire V and Murphy Daniel R
Home Financials for this Owner
Home Financials are based on the most recent Mortgage that was taken out on this home.
Original Mortgage
$351,400
Interest Rate
4.86%
Mortgage Type
Purchase Money Mortgage
Purchase Details
Closed on
Nov 19, 2001
Sold by
Petro Lisa J and Petro Lisa S
Bought by
Petro John P
Purchase Details
Closed on
Oct 15, 1997
Sold by
Degnen Stephen M and Degnen Carol A
Bought by
Petro John P and Petro Lisa Scott
Home Financials for this Owner
Home Financials are based on the most recent Mortgage that was taken out on this home.
Original Mortgage
$189,050
Interest Rate
7.65%
Create a Home Valuation Report for This Property
The Home Valuation Report is an in-depth analysis detailing your home's value as well as a comparison with similar homes in the area
Home Values in the Area
Average Home Value in this Area
Purchase History
| Date | Buyer | Sale Price | Title Company |
|---|---|---|---|
| Murphy Claire V | -- | None Listed On Document | |
| Murphy Claire V | $370,000 | Hummel Titl | |
| Petro John P | -- | -- | |
| Petro John P | $199,000 | -- |
Source: Public Records
Mortgage History
| Date | Status | Borrower | Loan Amount |
|---|---|---|---|
| Previous Owner | Murphy Claire V | $351,400 | |
| Previous Owner | Petro John P | $189,050 |
Source: Public Records
Tax History
| Year | Tax Paid | Tax Assessment Tax Assessment Total Assessment is a certain percentage of the fair market value that is determined by local assessors to be the total taxable value of land and additions on the property. | Land | Improvement |
|---|---|---|---|---|
| 2025 | $9,419 | $209,870 | $103,080 | $106,790 |
| 2024 | $9,419 | $209,870 | $103,080 | $106,790 |
| 2023 | $9,299 | $209,860 | $103,075 | $106,785 |
| 2022 | $9,674 | $186,520 | $40,920 | $145,600 |
| 2021 | $9,691 | $186,520 | $40,920 | $145,600 |
| 2020 | $9,704 | $186,520 | $40,920 | $145,600 |
| 2019 | $9,132 | $150,540 | $35,600 | $114,940 |
| 2018 | $8,310 | $150,540 | $35,600 | $114,940 |
| 2017 | $9,127 | $150,540 | $35,600 | $114,940 |
| 2016 | $8,268 | $124,820 | $29,160 | $95,660 |
| 2015 | $7,506 | $124,820 | $29,160 | $95,660 |
| 2014 | $7,524 | $124,820 | $29,160 | $95,660 |
| 2013 | $3,534 | $118,860 | $27,755 | $91,105 |
Source: Public Records
Map
Nearby Homes
- 243 E Whittier St Unit 245
- 136 E Whittier St
- 135 E Whittier St
- 253 E Kossuth St Unit 253-H
- 831 S Lazelle St
- 722 Mohawk St Unit 722
- 874 S High St
- 37 Stewart Ave
- 1010 Bruck St
- 717 S 3rd St
- 33 E Frankfort St
- 46 E Frankfort St
- 707 Sycamore Place Unit 707
- 242 E Sycamore St
- 955 S High St
- 10 - 20 E Deshler Ave
- 186 E Sycamore St
- 432 E Kossuth St
- 169 Thurman Ave Unit 169
- 995 S Wall St
- 862 Mohawk St
- 870 Mohawk St
- 856 Mohawk St Unit 860
- 860 Mohawk St
- 874 Mohawk St
- 865 Macon Aly
- 878 Mohawk St
- 185 Lansing St
- 850 Mohawk St
- 848 Mohawk St Unit 850
- 888 Mohawk St
- 170 E Whittier St
- 846 Mohawk St
- 184 E Whittier St
- 865 Mohawk St
- 186 E Whittier St
- 866 Macon Aly
- 842 Mohawk St
- 195 Lansing St
- 188 Lansing St
Your Personal Tour Guide
Ask me questions while you tour the home.