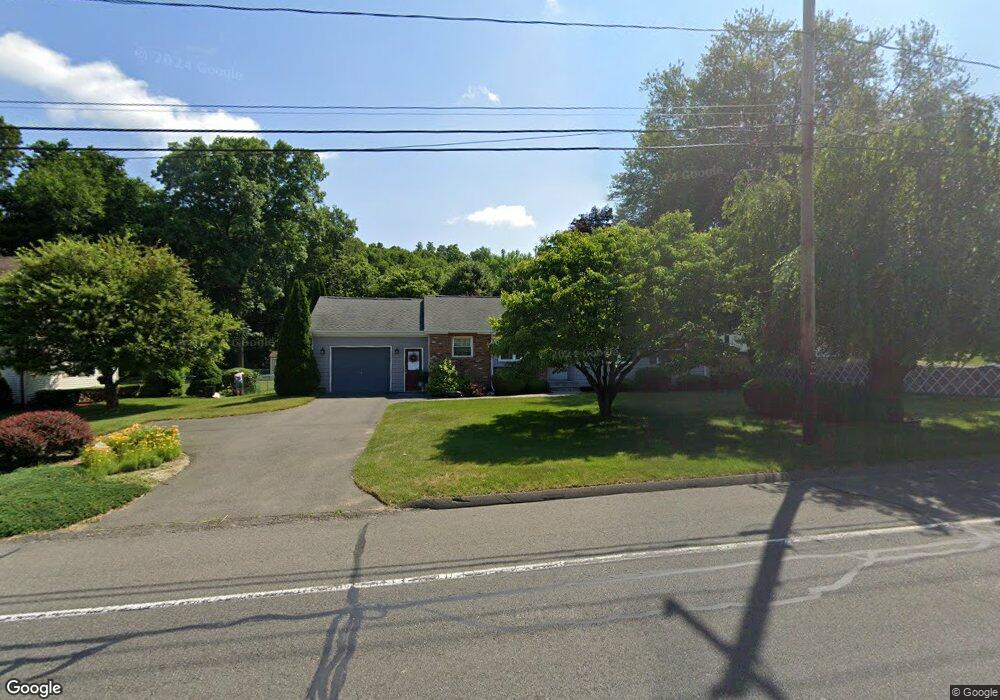
866 Montgomery St Chicopee, MA 01013
Aldenville NeighborhoodEstimated Value: $343,276 - $405,000
3
Beds
1
Bath
1,162
Sq Ft
$321/Sq Ft
Est. Value
About This Home
This home is located at 866 Montgomery St, Chicopee, MA 01013 and is currently estimated at $373,069, approximately $321 per square foot. 866 Montgomery St is a home located in Hampden County with nearby schools including Lambert-Lavoie Elementary School, Fairview Middle School, and Chicopee Comprehensive High School.
Ownership History
Date
Name
Owned For
Owner Type
Purchase Details
Closed on
Jun 17, 2016
Sold by
Bowler Lynn A
Bought by
Bowler Thomas J and Rosario Lisa M
Current Estimated Value
Purchase Details
Closed on
Dec 30, 1997
Sold by
Denault Ft
Bought by
Bowler Thomas J and Bowler Lynn A
Home Financials for this Owner
Home Financials are based on the most recent Mortgage that was taken out on this home.
Original Mortgage
$106,650
Interest Rate
7.15%
Mortgage Type
Purchase Money Mortgage
Create a Home Valuation Report for This Property
The Home Valuation Report is an in-depth analysis detailing your home's value as well as a comparison with similar homes in the area
Home Values in the Area
Average Home Value in this Area
Purchase History
| Date | Buyer | Sale Price | Title Company |
|---|---|---|---|
| Bowler Thomas J | -- | -- | |
| Bowler Thomas J | $118,500 | -- |
Source: Public Records
Mortgage History
| Date | Status | Borrower | Loan Amount |
|---|---|---|---|
| Previous Owner | Bowler Thomas J | $106,650 |
Source: Public Records
Tax History Compared to Growth
Tax History
| Year | Tax Paid | Tax Assessment Tax Assessment Total Assessment is a certain percentage of the fair market value that is determined by local assessors to be the total taxable value of land and additions on the property. | Land | Improvement |
|---|---|---|---|---|
| 2025 | $4,416 | $291,300 | $113,100 | $178,200 |
| 2024 | $4,189 | $283,800 | $110,900 | $172,900 |
| 2023 | $3,913 | $258,300 | $100,800 | $157,500 |
| 2022 | $3,726 | $219,300 | $87,700 | $131,600 |
| 2021 | $3,587 | $203,700 | $79,700 | $124,000 |
| 2020 | $3,396 | $194,500 | $78,900 | $115,600 |
| 2019 | $3,332 | $185,500 | $78,900 | $106,600 |
| 2018 | $3,252 | $177,600 | $75,200 | $102,400 |
| 2017 | $3,038 | $175,500 | $69,000 | $106,500 |
| 2016 | $3,035 | $179,500 | $69,000 | $110,500 |
| 2015 | $3,106 | $177,100 | $69,000 | $108,100 |
| 2014 | $1,553 | $177,100 | $69,000 | $108,100 |
Source: Public Records
Map
Nearby Homes
- 19 Dale Ct
- 1246 Granby Rd Unit 28
- 10 Rivest Ct
- 1150 Granby Rd
- 664 Mckinstry Ave
- 26 Olivine St
- 15 Riverview Place
- 21 Tourtelotte Ave
- 757 Chicopee St
- 20 Mount Carmel Ave
- 625 Mckinstry Ave
- 541 Grattan St
- 39 Fernwood St
- 34 Deslauriers St
- 124 Deslauriers St
- 599 Chicopee St
- 199 Meadow St
- 25 Andover Rd
- 80 Stewart St
- 130 Middle Water St
- 832 Montgomery St
- 872 Montgomery St
- 864 Montgomery St
- 886 Montgomery St
- 865 Montgomery St
- 873 Montgomery St
- 896 Montgomery St
- 836 Montgomery St
- 905 Montgomery St
- 95 Bridle Path Rd
- 39 Bridle Path Rd
- 89 Bridle Path Rd
- 51 Hunt Seat Dr
- 103 Bridle Path Rd
- 47 Hunt Seat Dr
- 51 Bridle Path Rd
- 35 Hunt Seat Dr
- 111 Bridle Path Rd
- 475 Dale St
- 90 Bridle Path Rd