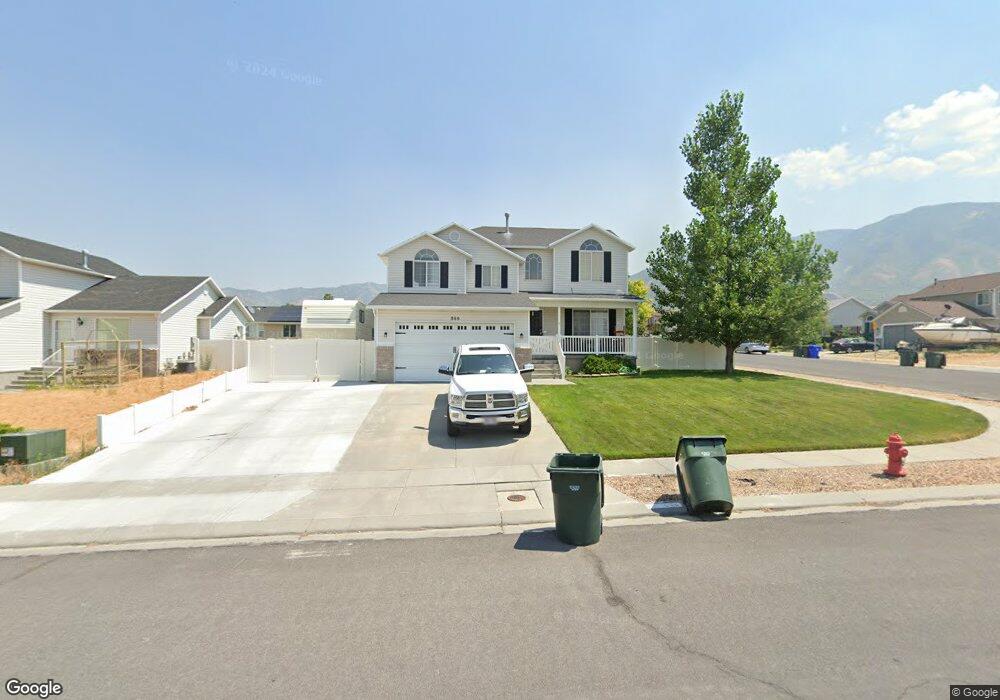
866 N 1340 E Tooele, UT 84074
Estimated Value: $424,000 - $463,000
3
Beds
3
Baths
1,916
Sq Ft
$230/Sq Ft
Est. Value
About This Home
This home is located at 866 N 1340 E, Tooele, UT 84074 and is currently estimated at $440,346, approximately $229 per square foot. 866 N 1340 E is a home located in Tooele County with nearby schools including Middle Canyon Elementary School, Tooele Junior High School, and Tooele High School.
Ownership History
Date
Name
Owned For
Owner Type
Purchase Details
Closed on
Aug 13, 2021
Sold by
Henwood Weston
Bought by
Henwood Weston and Henwood Ashton
Current Estimated Value
Home Financials for this Owner
Home Financials are based on the most recent Mortgage that was taken out on this home.
Original Mortgage
$255,500
Outstanding Balance
$232,329
Interest Rate
2.9%
Mortgage Type
New Conventional
Estimated Equity
$208,017
Purchase Details
Closed on
Oct 2, 2006
Sold by
The Secretary Of Hud
Bought by
Stevens Ammon J and Stevens Rachel U
Home Financials for this Owner
Home Financials are based on the most recent Mortgage that was taken out on this home.
Original Mortgage
$170,590
Interest Rate
6.43%
Mortgage Type
VA
Purchase Details
Closed on
Jun 1, 2006
Sold by
Irwin Mortgage Corp
Bought by
Secretary Of Hud
Purchase Details
Closed on
Mar 30, 2006
Sold by
Reece Justin L
Bought by
Irwin Mortgage Corp
Create a Home Valuation Report for This Property
The Home Valuation Report is an in-depth analysis detailing your home's value as well as a comparison with similar homes in the area
Purchase History
| Date | Buyer | Sale Price | Title Company |
|---|---|---|---|
| Henwood Weston | -- | Old Republic Title | |
| Stevens Ammon J | -- | Monument Title Ins | |
| Secretary Of Hud | -- | Backman Title | |
| Irwin Mortgage Corp | $153,781 | None Available |
Source: Public Records
Mortgage History
| Date | Status | Borrower | Loan Amount |
|---|---|---|---|
| Open | Henwood Weston | $255,500 | |
| Closed | Stevens Ammon J | $170,590 |
Source: Public Records
Tax History
| Year | Tax Paid | Tax Assessment Tax Assessment Total Assessment is a certain percentage of the fair market value that is determined by local assessors to be the total taxable value of land and additions on the property. | Land | Improvement |
|---|---|---|---|---|
| 2025 | $2,763 | $419,050 | $103,750 | $315,300 |
| 2024 | $3,022 | $230,688 | $57,063 | $173,625 |
| 2023 | $3,022 | $234,061 | $54,342 | $179,719 |
| 2022 | $2,876 | $247,471 | $54,227 | $193,244 |
| 2021 | $2,367 | $170,340 | $21,691 | $148,649 |
| 2020 | $2,249 | $280,751 | $39,438 | $241,313 |
| 2019 | $2,108 | $258,813 | $39,438 | $219,375 |
| 2018 | $1,940 | $225,911 | $40,000 | $185,911 |
| 2017 | $1,541 | $212,875 | $30,000 | $182,875 |
| 2016 | $1,258 | $103,962 | $16,500 | $87,462 |
| 2015 | $1,258 | $91,524 | $0 | $0 |
| 2014 | -- | $91,524 | $0 | $0 |
Source: Public Records
Map
Nearby Homes
- 1266 E 850 N
- 208 E 850 N Unit A
- 224 E 850 N St Unit A
- 224 E 850 N Unit D
- 208 E 850 N Unit C
- 238 E 850 St N Unit D
- 932 N 1250 E
- 1224 E 970 N
- 993 White Pine Dr
- 1046 Cedarwood Rd
- 677 Kings Landing
- 802 E 1120 N
- 743 N 690 E
- 647 E 980 N
- 792 E 540 N
- 618 E 670 N
- 936 N 580 E
- 1194 N 690 E
- 847 Uintah Ave
- 518 E 740 N
Your Personal Tour Guide
Ask me questions while you tour the home.