Estimated Value: $542,851 - $601,000
4
Beds
2
Baths
1,564
Sq Ft
$371/Sq Ft
Est. Value
About This Home
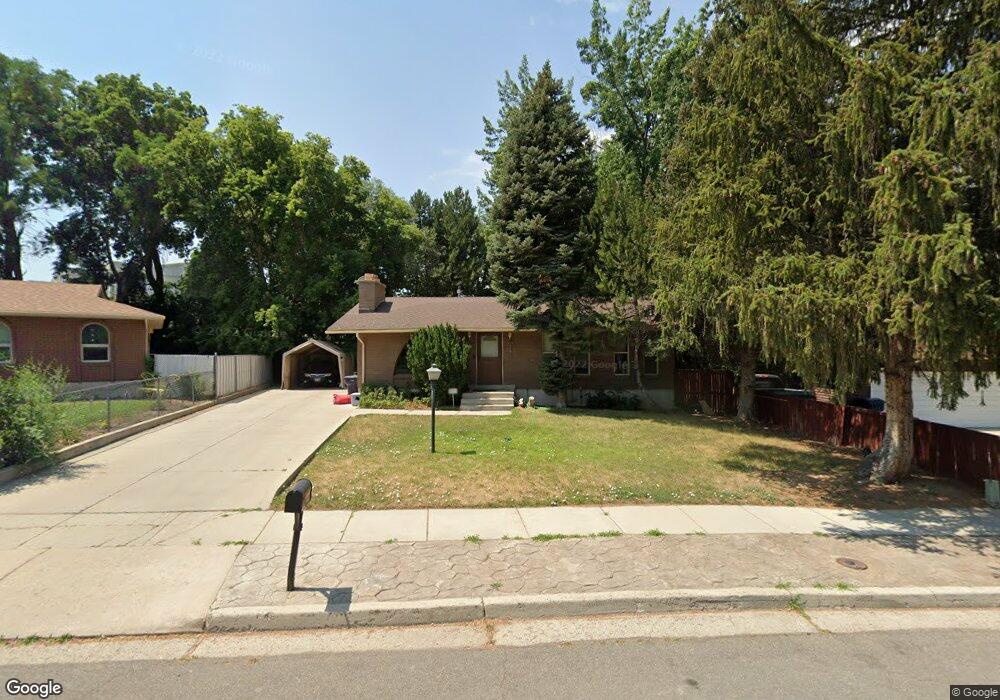
This home is located at 866 Spartan Dr, Sandy, UT 84094 and is currently estimated at $579,713, approximately $370 per square foot. 866 Spartan Dr is a home located in Salt Lake County with nearby schools including East Sandy School, Union Middle School, and Hillcrest High School.
Ownership History
Date
Name
Owned For
Owner Type
Purchase Details
Closed on
Jan 22, 2021
Sold by
Anderson Jesse J
Bought by
Anderson Jesse J and Dennerline Jessie
Current Estimated Value
Home Financials for this Owner
Home Financials are based on the most recent Mortgage that was taken out on this home.
Original Mortgage
$239,600
Outstanding Balance
$213,693
Interest Rate
2.67%
Mortgage Type
New Conventional
Estimated Equity
$366,020
Purchase Details
Closed on
Jul 18, 2018
Sold by
Anderson Bernice G and The Bernice G Anderson Family
Bought by
Anderson Bernice G and Anderson Jesse J
Home Financials for this Owner
Home Financials are based on the most recent Mortgage that was taken out on this home.
Original Mortgage
$202,000
Interest Rate
4.5%
Mortgage Type
New Conventional
Purchase Details
Closed on
Jan 17, 2012
Sold by
Anderson Bernice G
Bought by
Anderson Bernice G
Purchase Details
Closed on
Dec 1, 2003
Sold by
Anderson Ronald J
Bought by
Anderson Bernice G
Create a Home Valuation Report for This Property
The Home Valuation Report is an in-depth analysis detailing your home's value as well as a comparison with similar homes in the area
Home Values in the Area
Average Home Value in this Area
Purchase History
| Date | Buyer | Sale Price | Title Company |
|---|---|---|---|
| Anderson Jesse J | -- | Elevated Title | |
| Anderson Jesse J | -- | Elevated Title | |
| Anderson Bernice G | -- | First American Title | |
| Anderson Bernice G | -- | None Available | |
| Anderson Bernice G | -- | First American Title |
Source: Public Records
Mortgage History
| Date | Status | Borrower | Loan Amount |
|---|---|---|---|
| Open | Anderson Jesse J | $239,600 | |
| Closed | Anderson Bernice G | $202,000 |
Source: Public Records
Tax History Compared to Growth
Tax History
| Year | Tax Paid | Tax Assessment Tax Assessment Total Assessment is a certain percentage of the fair market value that is determined by local assessors to be the total taxable value of land and additions on the property. | Land | Improvement |
|---|---|---|---|---|
| 2025 | $2,774 | $523,800 | $207,200 | $316,600 |
| 2024 | $2,774 | $513,000 | $194,400 | $318,600 |
| 2023 | $2,469 | $455,300 | $184,700 | $270,600 |
| 2022 | $2,566 | $462,300 | $181,100 | $281,200 |
| 2021 | $2,200 | $337,300 | $151,600 | $185,700 |
| 2020 | $2,118 | $306,300 | $151,600 | $154,700 |
| 2019 | $2,112 | $297,600 | $143,000 | $154,600 |
| 2018 | $1,831 | $268,600 | $143,000 | $125,600 |
| 2017 | $1,829 | $256,400 | $143,000 | $113,400 |
| 2016 | $1,882 | $255,000 | $143,000 | $112,000 |
| 2015 | $1,779 | $223,000 | $144,500 | $78,500 |
| 2014 | $1,732 | $212,900 | $140,200 | $72,700 |
Source: Public Records
Map
Nearby Homes
- 8731 Gladiator Way
- 775 E Autumn Field Dr
- 8722 S Oakwood Park Cir Unit 8722
- 8729 S Leafwood Ln
- 8657 S 910 E
- 9083 Enchanted Oak Ln
- 8643 Vaquero Dr
- 9092 Enchanted Oak Ln
- 807 E Whisper Cove Rd
- 8915 S 660 E Unit 103
- 8732 S 620 E
- 608 E 8800 S
- 627 E 8680 S
- 9144 S Peach Blossom Dr
- 8935 Quarry Stone Way
- 783 E Newfield Dr Unit 146
- 8550 S 570 E
- 547 E Pioneer Ave
- 842 E 8270 S
- 772 E 8270 S
- 870 Spartan Dr
- 870 E Spartan Dr
- 858 Spartan Dr
- 876 Spartan Dr
- 852 Spartan Dr
- 867 Spartan Dr
- 867 E Spartan Dr
- 875 Spartan Dr
- 852 E Spartan Dr
- 859 Spartan Dr
- 859 E Spartan Dr
- 884 Spartan Dr
- 840 Spartan Dr
- 840 E Spartan Dr
- 883 Spartan Dr
- 855 Spartan Dr
- 894 Spartan Dr
- 847 E Spartan Dr
- 847 Spartan Dr
- 8820 S 910 E