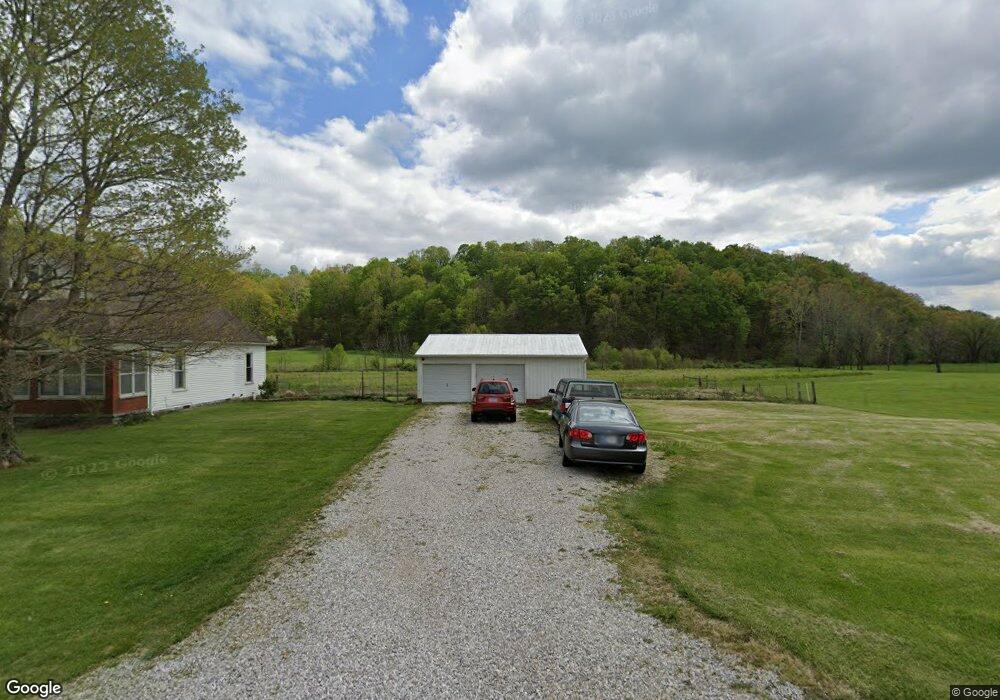
8661 Banet Rd Floyds Knobs, IN 47119
Floyds Knobs NeighborhoodEstimated Value: $256,000 - $312,000
4
Beds
2
Baths
1,306
Sq Ft
$219/Sq Ft
Est. Value
About This Home
This home is located at 8661 Banet Rd, Floyds Knobs, IN 47119 and is currently estimated at $285,831, approximately $218 per square foot. 8661 Banet Rd is a home located in Floyd County with nearby schools including Floyds Knobs Elementary School, Highland Hills Middle School, and Floyd Central High School.
Ownership History
Date
Name
Owned For
Owner Type
Purchase Details
Closed on
Sep 13, 2021
Sold by
Hollis Bradley J and Hollis Kori J
Bought by
Bierman Franklin and Bierman Franklin J
Current Estimated Value
Home Financials for this Owner
Home Financials are based on the most recent Mortgage that was taken out on this home.
Original Mortgage
$184,103
Outstanding Balance
$165,684
Interest Rate
2.8%
Mortgage Type
FHA
Estimated Equity
$120,147
Purchase Details
Closed on
Oct 1, 2014
Sold by
Juric Kristi L
Bought by
Hollis Bradley J and Hollis Kori J
Home Financials for this Owner
Home Financials are based on the most recent Mortgage that was taken out on this home.
Original Mortgage
$103,075
Interest Rate
4.08%
Mortgage Type
New Conventional
Purchase Details
Closed on
Aug 23, 2007
Sold by
Acra Linda S and Bierman Phillip R
Bought by
Hougland Krist L
Home Financials for this Owner
Home Financials are based on the most recent Mortgage that was taken out on this home.
Original Mortgage
$118,500
Interest Rate
6.72%
Mortgage Type
New Conventional
Create a Home Valuation Report for This Property
The Home Valuation Report is an in-depth analysis detailing your home's value as well as a comparison with similar homes in the area
Home Values in the Area
Average Home Value in this Area
Purchase History
| Date | Buyer | Sale Price | Title Company |
|---|---|---|---|
| Bierman Franklin | $375,000 | None Available | |
| Hollis Bradley J | -- | -- | |
| Hougland Krist L | -- | None Available |
Source: Public Records
Mortgage History
| Date | Status | Borrower | Loan Amount |
|---|---|---|---|
| Open | Bierman Franklin | $184,103 | |
| Previous Owner | Hollis Bradley J | $103,075 | |
| Previous Owner | Hougland Krist L | $118,500 |
Source: Public Records
Tax History
| Year | Tax Paid | Tax Assessment Tax Assessment Total Assessment is a certain percentage of the fair market value that is determined by local assessors to be the total taxable value of land and additions on the property. | Land | Improvement |
|---|---|---|---|---|
| 2025 | $1,480 | $183,800 | $35,800 | $148,000 |
| 2024 | $1,480 | $194,600 | $35,800 | $158,800 |
| 2023 | $1,189 | $168,800 | $35,800 | $133,000 |
| 2022 | $1,080 | $155,700 | $35,800 | $119,900 |
| 2021 | $936 | $145,500 | $35,800 | $109,700 |
| 2020 | $946 | $145,500 | $35,800 | $109,700 |
| 2019 | $781 | $129,400 | $35,800 | $93,600 |
| 2018 | $699 | $125,000 | $35,800 | $89,200 |
| 2017 | $671 | $115,100 | $35,800 | $79,300 |
| 2016 | $615 | $114,300 | $35,800 | $78,500 |
| 2014 | $608 | $100,700 | $35,800 | $64,900 |
| 2013 | -- | $104,200 | $35,800 | $68,400 |
Source: Public Records
Map
Nearby Homes
- 4435 Fosskuhl Rd
- 0 Old Oak Ridge Lot #5 Unit 202309649
- 3037 Martin Rd Unit 5
- 4107 Emma Lou Dr
- 4103 Andrew Dr
- Lot 34 S Skyline Dr
- LOT 17 S Skyline Dr
- 0 Erin Ct
- 5226 Buck Creek Rd
- 9305 N Skyline Dr
- 4605 Shadyview Dr
- 5200 Scottsville Rd
- 510 Payne Rd
- 13947 Deer Run Trace
- 13944 Deer Run Trace Unit LOT 420
- 13946 Deer Run Trace Unit LOT 421
- 13953 Deer Run Trace Unit LOT 405
- Lot 1 Jones Ln
- 4306 Jones Ln
- 0 Oakland Pkwy Unit 202605338
- 8617 Banet Rd
- 8717 Banet Rd
- 0 Banet Rd Unit 201506777
- 0 Banet Rd Unit 201506776
- 0 Banet Rd Unit 201506772
- 0 Banet Rd Unit 201506775
- 0 Banet Rd Unit 201506765
- 0 Banet Rd Unit 201506774
- 0 Banet Rd Unit 201506766
- 0 Banet Rd Unit 201601465
- 8718 Banet Rd
- 8725 Banet Rd
- 8762 Banet Rd
- 8618 Banet Rd
- 8760 Banet Rd
- 8803 Banet Rd
- 8609 Banet Rd
- 8828 Banet Rd
- 8837 Banet Rd
- 8525 Banet Rd
Your Personal Tour Guide
Ask me questions while you tour the home.