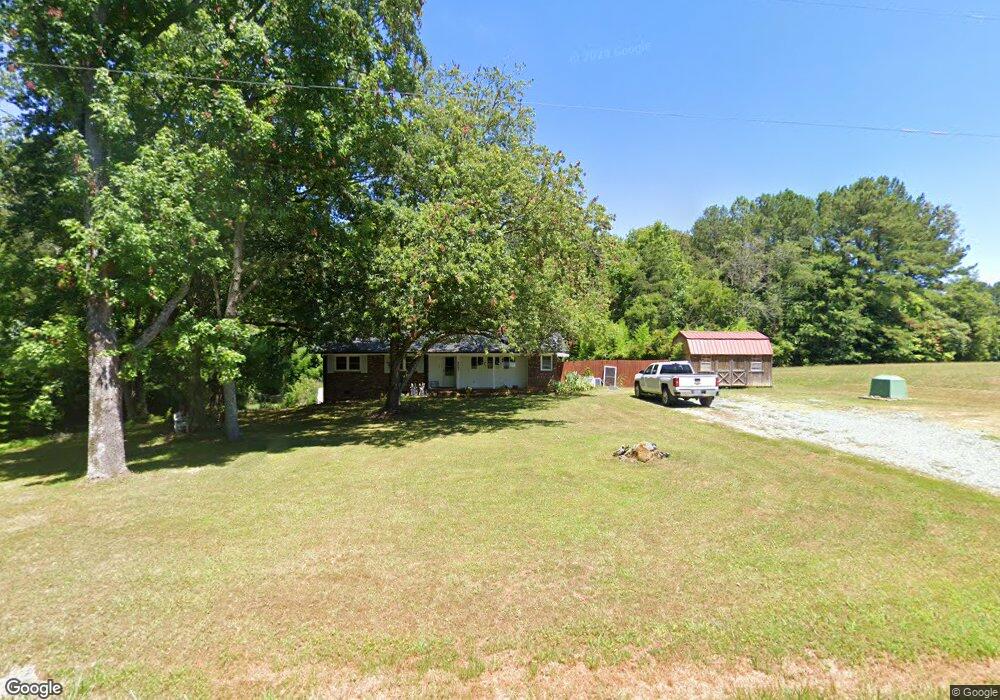
8662 Old 93 Rd Graham, NC 27253
Estimated Value: $230,000 - $344,000
3
Beds
2
Baths
1,390
Sq Ft
$205/Sq Ft
Est. Value
About This Home
This home is located at 8662 Old 93 Rd, Graham, NC 27253 and is currently estimated at $285,540, approximately $205 per square foot. 8662 Old 93 Rd is a home located in Alamance County with nearby schools including B. Everett Jordan Elementary School and Hawfields Middle School.
Ownership History
Date
Name
Owned For
Owner Type
Purchase Details
Closed on
Feb 11, 2021
Sold by
Kennedy Dennis and Kennedy Dennis
Bought by
Kennedy Dennis and Kennedy Jessica M
Current Estimated Value
Home Financials for this Owner
Home Financials are based on the most recent Mortgage that was taken out on this home.
Original Mortgage
$107,000
Outstanding Balance
$78,685
Interest Rate
2.65%
Mortgage Type
New Conventional
Estimated Equity
$206,855
Purchase Details
Closed on
Aug 22, 2008
Sold by
Averitt Barbara L
Bought by
Kennedy Dennis
Home Financials for this Owner
Home Financials are based on the most recent Mortgage that was taken out on this home.
Original Mortgage
$120,642
Interest Rate
6.21%
Mortgage Type
FHA
Purchase Details
Closed on
Jul 5, 2001
Sold by
Teague Maria F Gergen
Bought by
Averitt Barbara L
Home Financials for this Owner
Home Financials are based on the most recent Mortgage that was taken out on this home.
Original Mortgage
$81,000
Interest Rate
7.23%
Create a Home Valuation Report for This Property
The Home Valuation Report is an in-depth analysis detailing your home's value as well as a comparison with similar homes in the area
Home Values in the Area
Average Home Value in this Area
Purchase History
| Date | Buyer | Sale Price | Title Company |
|---|---|---|---|
| Kennedy Dennis | -- | Vylla Llc | |
| Kennedy Dennis | $121,000 | -- | |
| Averitt Barbara L | $90,000 | -- |
Source: Public Records
Mortgage History
| Date | Status | Borrower | Loan Amount |
|---|---|---|---|
| Open | Kennedy Dennis | $107,000 | |
| Closed | Kennedy Dennis | $120,642 | |
| Previous Owner | Averitt Barbara L | $81,000 |
Source: Public Records
Tax History Compared to Growth
Tax History
| Year | Tax Paid | Tax Assessment Tax Assessment Total Assessment is a certain percentage of the fair market value that is determined by local assessors to be the total taxable value of land and additions on the property. | Land | Improvement |
|---|---|---|---|---|
| 2025 | $1,237 | $213,363 | $32,202 | $181,161 |
| 2024 | $1,183 | $213,363 | $32,202 | $181,161 |
| 2023 | $1,104 | $213,363 | $32,202 | $181,161 |
| 2022 | $908 | $120,110 | $31,937 | $88,173 |
| 2021 | $920 | $120,110 | $31,937 | $88,173 |
| 2020 | $932 | $120,110 | $31,937 | $88,173 |
| 2019 | $901 | $120,110 | $31,937 | $88,173 |
| 2018 | $0 | $120,110 | $31,937 | $88,173 |
| 2017 | $793 | $120,110 | $31,937 | $88,173 |
| 2016 | $803 | $121,709 | $22,812 | $98,897 |
| 2015 | $801 | $121,989 | $22,812 | $99,177 |
| 2014 | -- | $121,989 | $22,812 | $99,177 |
Source: Public Records
Map
Nearby Homes
- 4322 Russell Rd
- 3880 L Lawrence Trail
- 4058 Whispering Oaks Ct
- 8450 Perry Rd
- 7528 McBane Mill Rd
- 0 Pete Thomas Rd
- 000 Windsor Rd
- 884 Windsor Rd
- 9402 N Carolina 87
- 7117 New Light Trail
- 00 Bowman Bare Rd
- 4604 Hopewood Dr
- 5065 Harrier Dr
- 97 Fox Oak Trail
- 5055 Harrier Dr
- 5050 Harrier Dr
- 7555 Babe Ruth Trail
- 5239 Dipper Dr
- 46 Chetango Mountain Rd
- WILMINGTON Plan at Aurora Acres
- 0 Old 93 Rd
- 9341 S Nc Highway 87
- 8625 Old 93 Rd
- 8728 Old 93 Rd
- 9309 S Nc Highway 87
- 9405 S Nc Highway 87
- 9405 N Carolina 87
- 9332 S Nc Highway 87
- 9124 S Nc Highway 87
- 8760 Old 93 Rd
- 4140 L Lawrence Trail
- 9350 S Nc Highway 87
- 4135 L Lawrence Trail
- 9506 S Nc Highway 87
- 4117 L Lawrence Trail
- 9124 John Glosson Trail
- 9566 S Nc Highway 87
- 9564 S Nc Highway 87
- 8869 Old 93 Rd
- 9119 John Glosson Trail