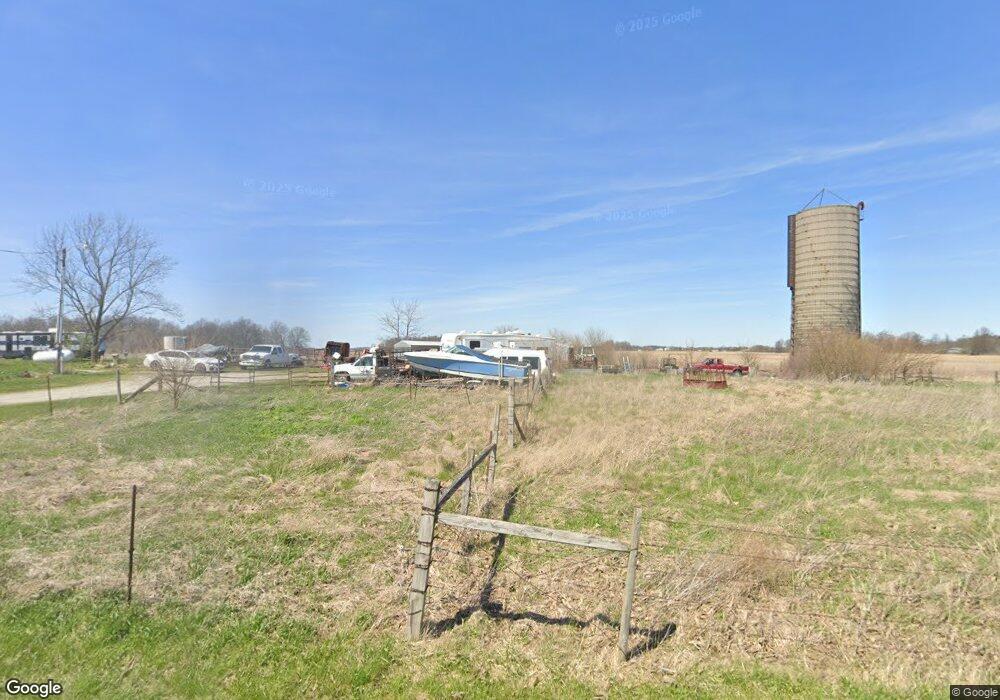
8663 E 200 N Marion, IN 46952
Estimated Value: $124,000 - $201,000
4
Beds
3
Baths
1,836
Sq Ft
$89/Sq Ft
Est. Value
About This Home
This home is located at 8663 E 200 N, Marion, IN 46952 and is currently estimated at $162,507, approximately $88 per square foot. 8663 E 200 N is a home located in Grant County.
Ownership History
Date
Name
Owned For
Owner Type
Purchase Details
Closed on
Mar 16, 2022
Sold by
Thurman Brenda G
Bought by
Christian Brook and Christian Eric Neal
Current Estimated Value
Purchase Details
Closed on
Feb 12, 2009
Sold by
Abbott Vicki J
Bought by
Hall Ernest W and Hall Brenda G
Home Financials for this Owner
Home Financials are based on the most recent Mortgage that was taken out on this home.
Original Mortgage
$41,600
Interest Rate
6.75%
Mortgage Type
Adjustable Rate Mortgage/ARM
Create a Home Valuation Report for This Property
The Home Valuation Report is an in-depth analysis detailing your home's value as well as a comparison with similar homes in the area
Purchase History
| Date | Buyer | Sale Price | Title Company |
|---|---|---|---|
| Christian Brook | -- | None Listed On Document | |
| Hall Ernest W | $52,000 | Grant Co Abstract | |
| Hall Ernett W | -- | None Available |
Source: Public Records
Mortgage History
| Date | Status | Borrower | Loan Amount |
|---|---|---|---|
| Previous Owner | Hall Ernett W | $41,600 |
Source: Public Records
Tax History
| Year | Tax Paid | Tax Assessment Tax Assessment Total Assessment is a certain percentage of the fair market value that is determined by local assessors to be the total taxable value of land and additions on the property. | Land | Improvement |
|---|---|---|---|---|
| 2025 | $852 | $87,400 | $23,900 | $63,500 |
| 2024 | $852 | $83,700 | $24,400 | $59,300 |
| 2023 | $443 | $80,400 | $23,200 | $57,200 |
| 2022 | $443 | $74,600 | $21,900 | $52,700 |
| 2021 | $980 | $66,600 | $21,200 | $45,400 |
| 2020 | $889 | $64,500 | $21,200 | $43,300 |
| 2019 | $859 | $65,400 | $22,100 | $43,300 |
| 2018 | $727 | $63,700 | $20,100 | $43,600 |
| 2017 | $702 | $62,500 | $20,500 | $42,000 |
| 2016 | $668 | $62,700 | $20,700 | $42,000 |
| 2014 | $615 | $60,900 | $20,900 | $40,000 |
| 2013 | $615 | $59,400 | $20,300 | $39,100 |
Source: Public Records
Map
Nearby Homes
Your Personal Tour Guide
Ask me questions while you tour the home.