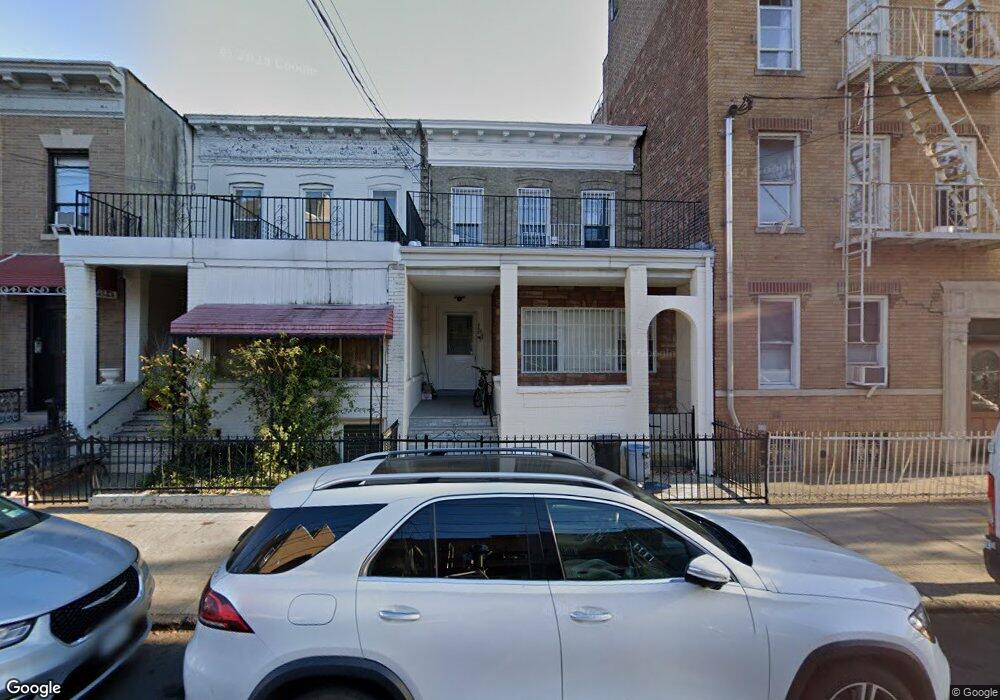
867 58th St Brooklyn, NY 11220
Sunset Park NeighborhoodEstimated Value: $1,425,951 - $2,125,000
Studio
--
Bath
2,168
Sq Ft
$816/Sq Ft
Est. Value
About This Home
This home is located at 867 58th St, Brooklyn, NY 11220 and is currently estimated at $1,768,238, approximately $815 per square foot. 867 58th St is a home located in Kings County with nearby schools including P.S. 105 The Blythebourne, I.S. 223 The Montauk, and Franklin Delano Roosevelt High School.
Ownership History
Date
Name
Owned For
Owner Type
Purchase Details
Closed on
Sep 8, 2022
Sold by
Chan Susan Ngim and Le Tony Quoc
Bought by
Chan Susan Ngim
Current Estimated Value
Purchase Details
Closed on
Dec 27, 1996
Sold by
Jaegersen Jane G
Bought by
Le Tony Quoc Cuong and Chan Susan Ngim
Home Financials for this Owner
Home Financials are based on the most recent Mortgage that was taken out on this home.
Original Mortgage
$120,000
Interest Rate
7.48%
Create a Home Valuation Report for This Property
The Home Valuation Report is an in-depth analysis detailing your home's value as well as a comparison with similar homes in the area
Home Values in the Area
Average Home Value in this Area
Purchase History
| Date | Buyer | Sale Price | Title Company |
|---|---|---|---|
| Chan Susan Ngim | $730,000 | -- | |
| Le Tony Quoc Cuong | $196,000 | Commonwealth Land Title Ins |
Source: Public Records
Mortgage History
| Date | Status | Borrower | Loan Amount |
|---|---|---|---|
| Closed | Le Tony Quoc Cuong | $120,000 |
Source: Public Records
Tax History
| Year | Tax Paid | Tax Assessment Tax Assessment Total Assessment is a certain percentage of the fair market value that is determined by local assessors to be the total taxable value of land and additions on the property. | Land | Improvement |
|---|---|---|---|---|
| 2025 | $8,463 | $85,860 | $20,040 | $65,820 |
| 2024 | $8,463 | $92,700 | $20,040 | $72,660 |
| 2023 | $8,557 | $97,140 | $20,040 | $77,100 |
| 2022 | $7,280 | $95,520 | $20,040 | $75,480 |
| 2021 | $7,951 | $86,280 | $20,040 | $66,240 |
| 2019 | $7,052 | $88,080 | $20,040 | $68,040 |
| 2018 | $6,860 | $35,112 | $5,965 | $29,147 |
| 2017 | $6,493 | $33,321 | $7,017 | $26,304 |
| 2016 | $6,254 | $32,835 | $8,040 | $24,795 |
| 2015 | -- | $30,978 | $9,174 | $21,804 |
| 2014 | -- | $29,260 | $10,396 | $18,864 |
Source: Public Records
Map
Nearby Homes
- 847 58th St
- 803 58th St
- 849 57th St Unit 101
- 821 57th St Unit 3B
- 869 57th St Unit 205
- 860 56th St
- 864 59th St
- 864 56th St Unit 4C
- 864 56th St Unit 4B
- 864 56th St Unit 4A
- 831 56th St
- 867 56th St
- 873 60th St
- 875 60th St
- 838 55th St
- 763 57th St
- 759 57th St
- 928 57th St Unit 3R
- 928 57th St Unit 2R
- 818 60th St Unit 6B
Your Personal Tour Guide
Ask me questions while you tour the home.