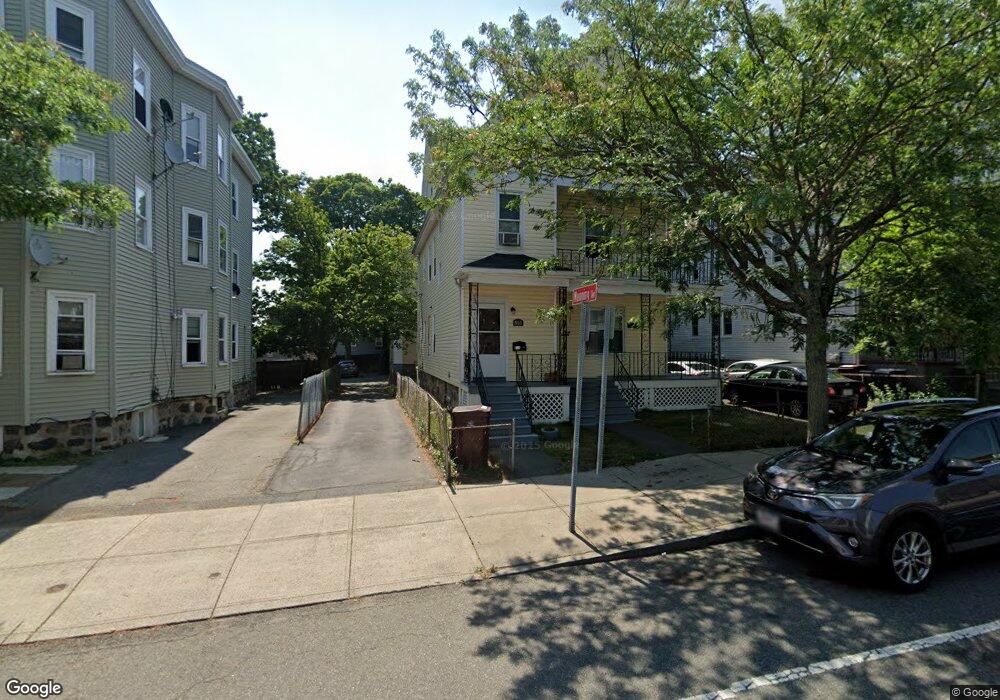
867 Broadway Everett, MA 02149
Glendale NeighborhoodEstimated Value: $731,000 - $955,000
3
Beds
3
Baths
2,827
Sq Ft
$307/Sq Ft
Est. Value
About This Home
This home is located at 867 Broadway, Everett, MA 02149 and is currently estimated at $867,029, approximately $306 per square foot. 867 Broadway is a home located in Middlesex County with nearby schools including Everett High School and Pioneer Charter School of Science.
Ownership History
Date
Name
Owned For
Owner Type
Purchase Details
Closed on
Mar 3, 2011
Sold by
Osgood Dorothy
Bought by
Everett City Of
Current Estimated Value
Purchase Details
Closed on
Oct 6, 2006
Sold by
Osgood Dorothy
Bought by
Bukhari Syed N
Home Financials for this Owner
Home Financials are based on the most recent Mortgage that was taken out on this home.
Original Mortgage
$257,600
Interest Rate
6.54%
Mortgage Type
Purchase Money Mortgage
Create a Home Valuation Report for This Property
The Home Valuation Report is an in-depth analysis detailing your home's value as well as a comparison with similar homes in the area
Home Values in the Area
Average Home Value in this Area
Purchase History
| Date | Buyer | Sale Price | Title Company |
|---|---|---|---|
| Everett City Of | -- | -- | |
| Bukhari Syed N | $322,000 | -- |
Source: Public Records
Mortgage History
| Date | Status | Borrower | Loan Amount |
|---|---|---|---|
| Previous Owner | Bukhari Syed N | $257,600 |
Source: Public Records
Tax History Compared to Growth
Tax History
| Year | Tax Paid | Tax Assessment Tax Assessment Total Assessment is a certain percentage of the fair market value that is determined by local assessors to be the total taxable value of land and additions on the property. | Land | Improvement |
|---|---|---|---|---|
| 2025 | $9,752 | $856,200 | $250,200 | $606,000 |
| 2024 | $8,907 | $777,200 | $219,300 | $557,900 |
| 2023 | $8,684 | $737,200 | $209,700 | $527,500 |
| 2022 | $7,051 | $680,600 | $200,200 | $480,400 |
| 2021 | $6,327 | $641,000 | $179,200 | $461,800 |
| 2020 | $6,648 | $624,800 | $179,200 | $445,600 |
| 2019 | $7,022 | $567,200 | $170,600 | $396,600 |
| 2018 | $6,873 | $498,800 | $148,700 | $350,100 |
| 2017 | $6,537 | $452,700 | $133,500 | $319,200 |
| 2016 | $5,842 | $404,300 | $119,200 | $285,100 |
| 2015 | $5,330 | $364,800 | $107,500 | $257,300 |
Source: Public Records
Map
Nearby Homes
- 859 Broadway Unit 15
- 378 Ferry St
- 10 Clay Ave
- 132 Vernal St
- 18 Lynn St
- 8 Parker St Unit 8
- 21 Hillside Ave Unit 21
- 112 Hadley St
- 12 Holloway St
- 33 Lodgen Ct Unit 4G
- 20 Fairmount St
- 74 Madison Ave
- 46 Garland St
- 21 Central Ave Unit 10
- 21 Staples Ave Unit 26
- 43 Jefferson Ave
- 272-274 Cross St Unit 1
- 272-274 Cross St Unit 4
- 272-274 Cross St Unit 3
- 272-274 Cross St Unit 5
- 865 Broadway
- 1 Manning Terrace Unit 2
- 1 Manning Terrace
- 877 Broadway
- 871 Broadway
- 859 Broadway Unit 16
- 859 Broadway Unit 14
- 859 Broadway Unit 13
- 859 Broadway Unit 12
- 859 Broadway Unit 11
- 859 Broadway Unit 10
- 859 Broadway Unit 9
- 859 Broadway Unit 8
- 859 Broadway Unit 7
- 859 Broadway Unit 6
- 859 Broadway Unit 5
- 859 Broadway Unit 4
- 859 Broadway Unit 3
- 859 Broadway Unit 2
- 859 Broadway Unit 1