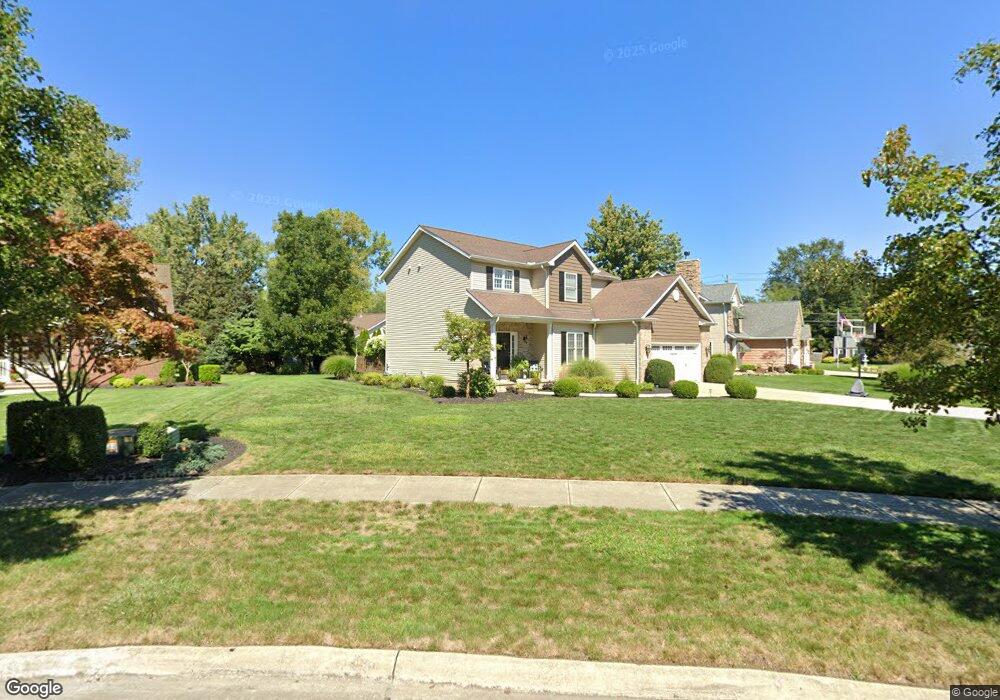
867 Cove Ct Eastlake, OH 44095
Estimated Value: $296,000 - $325,516
3
Beds
3
Baths
1,116
Sq Ft
$283/Sq Ft
Est. Value
About This Home
This home is located at 867 Cove Ct, Eastlake, OH 44095 and is currently estimated at $315,879, approximately $283 per square foot. 867 Cove Ct is a home located in Lake County with nearby schools including Jefferson Elementary School, Eastlake Middle School, and North High School.
Ownership History
Date
Name
Owned For
Owner Type
Purchase Details
Closed on
Jun 11, 2001
Sold by
N E Monarch Homes Inc
Bought by
Schwenk Brian J and Schwenk Karla A
Current Estimated Value
Home Financials for this Owner
Home Financials are based on the most recent Mortgage that was taken out on this home.
Original Mortgage
$176,900
Interest Rate
7.16%
Purchase Details
Closed on
Feb 2, 1999
Sold by
Yachtmens Cove Estates Ltd Partnership
Bought by
N E Monarch Homes Inc
Purchase Details
Closed on
Feb 12, 1998
Sold by
Yachtsmens Cove Estates Ltd Partnership
Bought by
Lanmark Homes Inc
Home Financials for this Owner
Home Financials are based on the most recent Mortgage that was taken out on this home.
Original Mortgage
$171,750
Interest Rate
7.08%
Create a Home Valuation Report for This Property
The Home Valuation Report is an in-depth analysis detailing your home's value as well as a comparison with similar homes in the area
Home Values in the Area
Average Home Value in this Area
Purchase History
| Date | Buyer | Sale Price | Title Company |
|---|---|---|---|
| Schwenk Brian J | $208,200 | Midland Title Security Inc | |
| N E Monarch Homes Inc | $49,900 | House Of Title Agency Inc, T | |
| Lanmark Homes Inc | $49,900 | House Of Title Agency Inc, T |
Source: Public Records
Mortgage History
| Date | Status | Borrower | Loan Amount |
|---|---|---|---|
| Open | Schwenk Brian J | $68,000 | |
| Closed | Schwenk Brian J | $169,600 | |
| Closed | Schwenk Brian J | $35,000 | |
| Closed | Schwenk Brian J | $184,000 | |
| Closed | Schwenk Brian J | $10,000 | |
| Closed | Schwenk Brian J | $10,000 | |
| Closed | Schwenk Brian J | $176,900 | |
| Previous Owner | N E Monarch Homes Inc | $150,000 | |
| Previous Owner | Lanmark Homes Inc | $171,750 |
Source: Public Records
Tax History Compared to Growth
Tax History
| Year | Tax Paid | Tax Assessment Tax Assessment Total Assessment is a certain percentage of the fair market value that is determined by local assessors to be the total taxable value of land and additions on the property. | Land | Improvement |
|---|---|---|---|---|
| 2024 | -- | $103,690 | $18,210 | $85,480 |
| 2023 | $8,684 | $89,860 | $14,540 | $75,320 |
| 2022 | $5,728 | $89,860 | $14,540 | $75,320 |
| 2021 | $5,754 | $89,860 | $14,540 | $75,320 |
| 2020 | $5,629 | $78,150 | $12,650 | $65,500 |
| 2019 | $5,238 | $78,150 | $12,650 | $65,500 |
| 2018 | $5,080 | $70,970 | $12,080 | $58,890 |
| 2017 | $4,991 | $70,970 | $12,080 | $58,890 |
| 2016 | $4,662 | $70,970 | $12,080 | $58,890 |
| 2015 | $4,604 | $70,970 | $12,080 | $58,890 |
| 2014 | $4,366 | $70,970 | $12,080 | $58,890 |
| 2013 | $4,367 | $70,970 | $12,080 | $58,890 |
Source: Public Records
Map
Nearby Homes
- 36765 Garretts Cove Dr
- 906 Cottonwood Ct
- 847 Audrey Dr
- V/L 11 Carlton Dr
- V/L 12 Carlton Dr
- V/L 13-14 Carlton Dr
- 36843 Stevens Blvd
- 37584 Ocean Reef
- 3780 E 364th St
- 35783 Lakeshore Blvd
- 35821 Meyer Ave
- 34779 Beach Park Ave
- 1222 E 360th St
- 1041 E 349th St
- 1270 E 362nd St
- 988 E 348th St
- 764 E 347th St
- 34682 Iris Ln
- 34633 Glen Dr
- 34622 Iris Ln