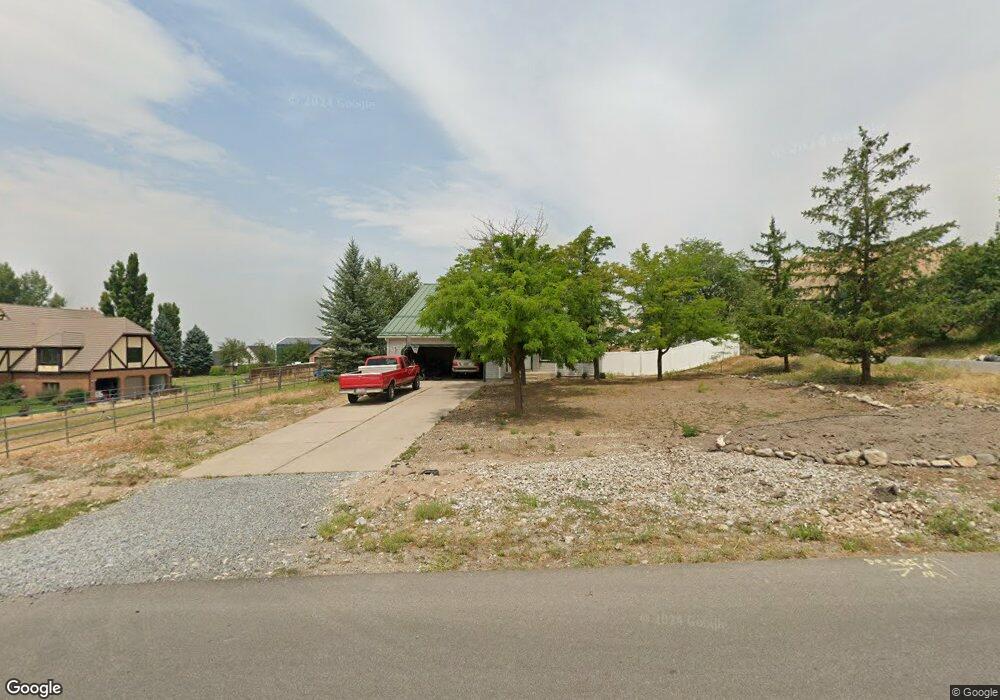
867 E 300 N Hyde Park, UT 84318
Estimated Value: $540,000 - $595,000
5
Beds
3
Baths
2,980
Sq Ft
$192/Sq Ft
Est. Value
About This Home
This home is located at 867 E 300 N, Hyde Park, UT 84318 and is currently estimated at $571,200, approximately $191 per square foot. 867 E 300 N is a home located in Cache County with nearby schools including North Park School, Cedar Ridge School, and North Cache Middle School.
Ownership History
Date
Name
Owned For
Owner Type
Purchase Details
Closed on
Oct 5, 2022
Sold by
Richard H Wiedeman And Janet R Albers Re
Bought by
Murdock Blair and Murdock Stacy
Current Estimated Value
Home Financials for this Owner
Home Financials are based on the most recent Mortgage that was taken out on this home.
Original Mortgage
$380,000
Outstanding Balance
$363,414
Interest Rate
5.55%
Mortgage Type
New Conventional
Estimated Equity
$207,786
Purchase Details
Closed on
Oct 27, 2011
Sold by
Weiderman Richard H and Albers Janet R
Bought by
Wiedeman Richard H and Albers Janet R
Purchase Details
Closed on
Mar 7, 2011
Sold by
Albers Janet R
Bought by
Weiderman Richard H and Albers Janet R
Home Financials for this Owner
Home Financials are based on the most recent Mortgage that was taken out on this home.
Original Mortgage
$202,400
Interest Rate
4.71%
Mortgage Type
New Conventional
Purchase Details
Closed on
Mar 3, 2011
Sold by
Parker Vernon D and Parker Monica S
Bought by
Albers Janet R
Home Financials for this Owner
Home Financials are based on the most recent Mortgage that was taken out on this home.
Original Mortgage
$202,400
Interest Rate
4.71%
Mortgage Type
New Conventional
Create a Home Valuation Report for This Property
The Home Valuation Report is an in-depth analysis detailing your home's value as well as a comparison with similar homes in the area
Home Values in the Area
Average Home Value in this Area
Purchase History
| Date | Buyer | Sale Price | Title Company |
|---|---|---|---|
| Murdock Blair | -- | Cache Title | |
| Murdock Blair | -- | Cache Title | |
| Wiedeman Richard H | -- | None Available | |
| Weiderman Richard H | -- | Heritage Title | |
| Albers Janet R | -- | Heritage Title |
Source: Public Records
Mortgage History
| Date | Status | Borrower | Loan Amount |
|---|---|---|---|
| Open | Murdock Blair | $380,000 | |
| Closed | Murdock Blair | $380,000 | |
| Previous Owner | Albers Janet R | $202,400 |
Source: Public Records
Tax History
| Year | Tax Paid | Tax Assessment Tax Assessment Total Assessment is a certain percentage of the fair market value that is determined by local assessors to be the total taxable value of land and additions on the property. | Land | Improvement |
|---|---|---|---|---|
| 2025 | $2,235 | $308,105 | $0 | $0 |
| 2024 | $2,346 | $298,235 | $0 | $0 |
| 2023 | $2,252 | $272,310 | $0 | $0 |
| 2022 | $2,342 | $272,340 | $0 | $0 |
| 2021 | $2,226 | $401,620 | $101,500 | $300,120 |
| 2020 | $2,057 | $352,400 | $101,500 | $250,900 |
| 2019 | $1,948 | $317,600 | $101,500 | $216,100 |
| 2018 | $1,766 | $281,910 | $82,250 | $199,660 |
| 2017 | $1,709 | $145,425 | $0 | $0 |
| 2016 | $1,734 | $145,425 | $0 | $0 |
| 2015 | $1,715 | $145,425 | $0 | $0 |
| 2014 | $1,611 | $140,105 | $0 | $0 |
| 2013 | -- | $135,650 | $0 | $0 |
Source: Public Records
Map
Nearby Homes
- 120 N 900 E
- 128 N 900 E
- 898 E 260 N
- 444 N 890 E Unit 179
- 940 E Canyon Rd
- 803 E 160 N Unit 1
- 882 E 160 N Unit 4
- 1087 E 160 N
- 458 W Madison St S
- 1130 E 245 N
- 201 N 1000 E Unit 19
- 1109 E 245 N
- 830 E 410 N Unit 161
- 454 W Madison St S
- 1070 E 200 N Unit 24
- 480 N 729 E
- 640 S 175 E
- 150 E 650 S Unit 108
- 635 S 125 E Unit 120
- 626 S 125 E
- 120 N 900 E Unit 9
- 134 N 900 E Unit 7
- 125 N 900 E Unit 17
- 135 N 900 E Unit 18
- 74 N 900 E Unit 43
- 62 N 900 E Unit 42
- 25 N 900 E Unit 38
- 128 N 900 E Unit 8
- 845 E 300 N
- 913 E 300 N
- 855 E 260 N
- 353 N 900 E
- 821 E 300 N
- 941 E 300 N
- 364 N 900 E
- 910 E 300 N
- 845 E 260 N
- 400 Greystone Dr
- 799 E 300 N
- 802 E 300 N
Your Personal Tour Guide
Ask me questions while you tour the home.