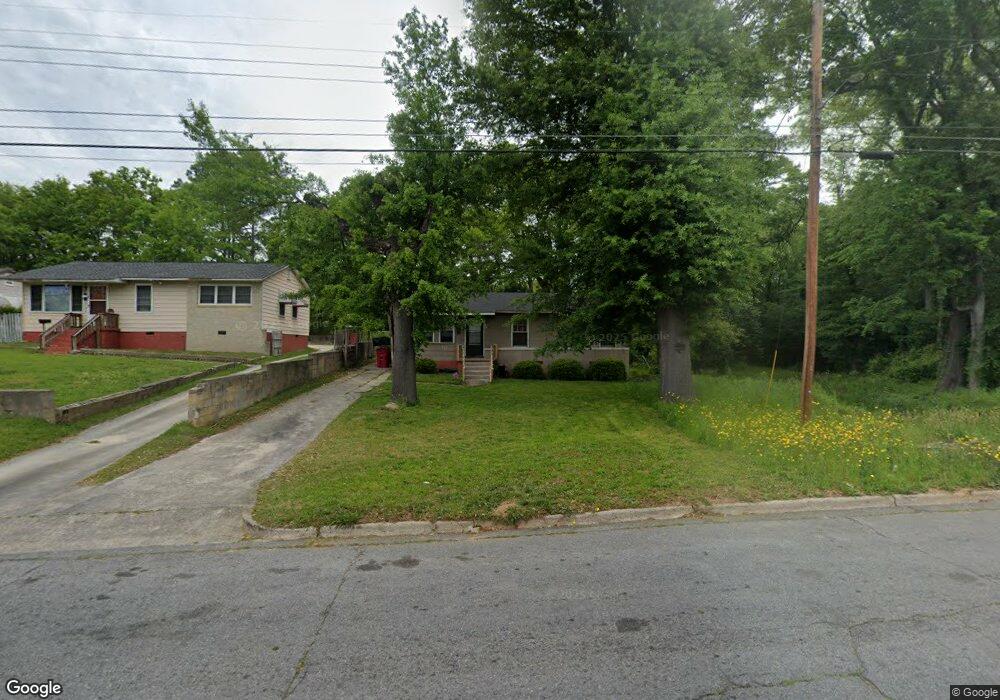
867 Ell St Macon, GA 31206
Estimated Value: $27,000 - $49,000
3
Beds
1
Bath
942
Sq Ft
$40/Sq Ft
Est. Value
About This Home
This home is located at 867 Ell St, Macon, GA 31206 and is currently estimated at $38,000, approximately $40 per square foot. 867 Ell St is a home located in Bibb County with nearby schools including Ingram-Pye Elementary School, Southwest High School, and Cirrus Charter Academy.
Ownership History
Date
Name
Owned For
Owner Type
Purchase Details
Closed on
Feb 24, 2021
Sold by
S & S Property Investment Llc
Bought by
Creatwe Investment Strategies Inc
Current Estimated Value
Purchase Details
Closed on
Nov 28, 2007
Sold by
Malone Marklin
Bought by
S & S Investment Properties Llc
Purchase Details
Closed on
Jul 3, 2007
Purchase Details
Closed on
May 1, 2005
Purchase Details
Closed on
Mar 24, 2005
Purchase Details
Closed on
Dec 7, 2004
Purchase Details
Closed on
Feb 7, 2002
Create a Home Valuation Report for This Property
The Home Valuation Report is an in-depth analysis detailing your home's value as well as a comparison with similar homes in the area
Home Values in the Area
Average Home Value in this Area
Purchase History
| Date | Buyer | Sale Price | Title Company |
|---|---|---|---|
| Creatwe Investment Strategies Inc | $142,500 | None Available | |
| S & S Investment Properties Llc | $10,500 | None Available | |
| Malone Marklin | $10,500 | None Available | |
| -- | $15,800 | -- | |
| Citibank Na | $15,790 | None Available | |
| -- | -- | -- | |
| -- | $15,000 | -- | |
| -- | $1,300 | -- | |
| -- | $20,000 | -- | |
| Robinson Linda | -- | None Available | |
| -- | $68,000 | -- |
Source: Public Records
Tax History Compared to Growth
Tax History
| Year | Tax Paid | Tax Assessment Tax Assessment Total Assessment is a certain percentage of the fair market value that is determined by local assessors to be the total taxable value of land and additions on the property. | Land | Improvement |
|---|---|---|---|---|
| 2025 | $88 | $3,570 | $3,570 | $0 |
| 2024 | $91 | $3,570 | $3,570 | $0 |
| 2023 | $503 | $19,824 | $3,570 | $16,254 |
| 2022 | $379 | $10,935 | $3,091 | $7,844 |
| 2021 | $377 | $9,913 | $2,782 | $7,131 |
| 2020 | $385 | $9,913 | $2,782 | $7,131 |
| 2019 | $288 | $7,369 | $3,091 | $4,278 |
| 2018 | $622 | $7,369 | $3,091 | $4,278 |
| 2017 | $276 | $7,369 | $3,091 | $4,278 |
| 2016 | $255 | $7,370 | $3,091 | $4,278 |
| 2015 | $361 | $7,370 | $3,091 | $4,278 |
| 2014 | $415 | $7,370 | $3,091 | $4,278 |
Source: Public Records
Map
Nearby Homes