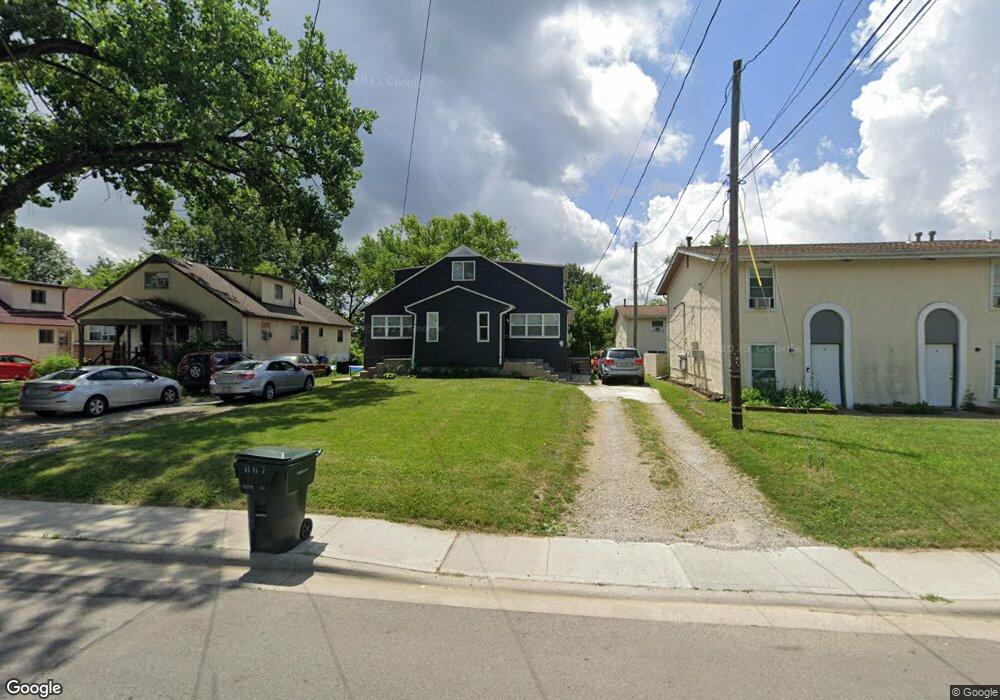
867 Moon Rd Unit 869 Columbus, OH 43224
North Linden NeighborhoodEstimated Value: $217,000 - $265,000
3
Beds
1
Bath
2,201
Sq Ft
$109/Sq Ft
Est. Value
About This Home
This home is located at 867 Moon Rd Unit 869, Columbus, OH 43224 and is currently estimated at $240,625, approximately $109 per square foot. 867 Moon Rd Unit 869 is a home located in Franklin County with nearby schools including Maize Road Elementary School, Medina Middle School, and Mifflin High School.
Ownership History
Date
Name
Owned For
Owner Type
Purchase Details
Closed on
Jun 16, 2025
Sold by
Hines Darnell and Hines Leslie R
Bought by
Hines Family Trust and Hines
Current Estimated Value
Purchase Details
Closed on
Jun 3, 2021
Sold by
Bohanon Jocelyn C
Bought by
Hines Darnell and Hines Leslie R
Home Financials for this Owner
Home Financials are based on the most recent Mortgage that was taken out on this home.
Original Mortgage
$108,750
Interest Rate
2.9%
Mortgage Type
New Conventional
Purchase Details
Closed on
Mar 20, 2003
Sold by
Mccarty Ronald J and Mccarty Wendy S
Bought by
Bohanon Jocelyn G
Home Financials for this Owner
Home Financials are based on the most recent Mortgage that was taken out on this home.
Original Mortgage
$103,506
Interest Rate
5.94%
Mortgage Type
FHA
Purchase Details
Closed on
Apr 22, 1998
Sold by
Bella Michael T and Bella Eugene J
Bought by
Mccarty Ronald J and Mcarty Wendy S
Purchase Details
Closed on
Mar 7, 1990
Purchase Details
Closed on
May 1, 1979
Create a Home Valuation Report for This Property
The Home Valuation Report is an in-depth analysis detailing your home's value as well as a comparison with similar homes in the area
Home Values in the Area
Average Home Value in this Area
Purchase History
| Date | Buyer | Sale Price | Title Company |
|---|---|---|---|
| Hines Family Trust | -- | None Listed On Document | |
| Hines Darnell | $145,000 | Premier Service Title | |
| Bohanon Jocelyn G | $104,400 | Chicago Title | |
| Mccarty Ronald J | $77,000 | Chicago Title West | |
| -- | $75,000 | -- | |
| -- | $54,500 | -- |
Source: Public Records
Mortgage History
| Date | Status | Borrower | Loan Amount |
|---|---|---|---|
| Previous Owner | Hines Darnell | $108,750 | |
| Previous Owner | Bohanon Jocelyn G | $103,506 |
Source: Public Records
Tax History Compared to Growth
Tax History
| Year | Tax Paid | Tax Assessment Tax Assessment Total Assessment is a certain percentage of the fair market value that is determined by local assessors to be the total taxable value of land and additions on the property. | Land | Improvement |
|---|---|---|---|---|
| 2024 | $3,338 | $73,610 | $17,570 | $56,040 |
| 2023 | $3,446 | $73,610 | $17,570 | $56,040 |
| 2022 | $2,480 | $44,380 | $9,030 | $35,350 |
| 2021 | $3,722 | $44,380 | $9,030 | $35,350 |
| 2020 | $2,516 | $44,380 | $9,030 | $35,350 |
| 2019 | $2,357 | $35,490 | $7,210 | $28,280 |
| 2018 | $2,320 | $35,490 | $7,210 | $28,280 |
| 2017 | $2,206 | $35,490 | $7,210 | $28,280 |
| 2016 | $2,124 | $31,260 | $6,340 | $24,920 |
| 2015 | $1,983 | $31,260 | $6,340 | $24,920 |
| 2014 | $1,938 | $31,260 | $6,340 | $24,920 |
| 2013 | $1,243 | $32,865 | $6,650 | $26,215 |
Source: Public Records
Map
Nearby Homes
- 886 Carolyn Ave
- 876 Lenore Ave
- 3724 Eisenhower Rd
- 780 Moon Rd
- 924 Northridge Rd
- 3476 Beulah Rd
- 3480 Maize Rd
- 1090 Pauline Ave
- 995 Overbrook Service Dr
- 587 Richards Rd
- 540 Fallis Rd
- 1120 Piedmont Rd
- 1126 Piedmont Rd
- 4000 Indianola Ave
- 541 Northridge Rd
- 467 Brevoort Rd
- 1283 Pauline Ave
- 685 Yaronia Dr N
- 788 E Brighton Rd
- 1279 Carolyn Ave
- 867 Moon Rd Unit 99
- 855 Moon Rd
- 875 Moon Rd Unit 5
- 873 Moon Rd Unit 875
- 853 Moon Rd
- 879 Moon Rd Unit 881
- 865 Moon Rd
- 845 Moon Rd
- 856 Pauline Ave
- 887 Moon Rd
- 864 Pauline Ave
- 870 Pauline Ave
- 848 Pauline Ave
- 3659 Eisenhower Rd
- 876 Pauline Ave
- 891 Moon Rd Unit 893
- 3660 Eisenhower Rd
- 3667 Eisenhower Rd
- 884 Pauline Ave
- 846 Moon Rd