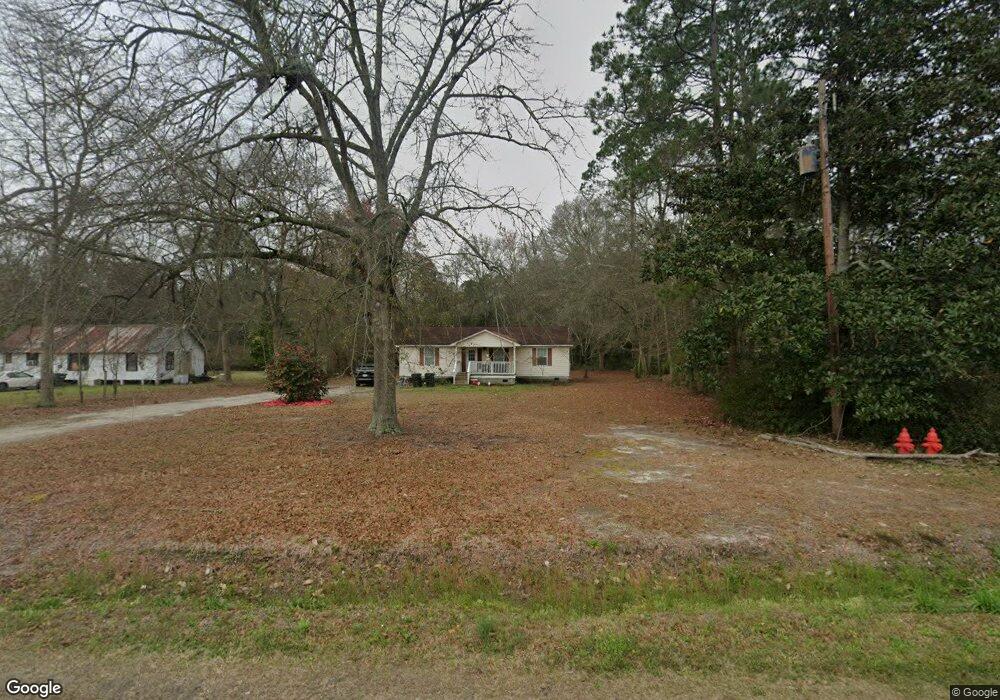
867 N Main St Pembroke, GA 31321
Estimated Value: $130,000 - $244,000
3
Beds
2
Baths
1,152
Sq Ft
$156/Sq Ft
Est. Value
About This Home
This home is located at 867 N Main St, Pembroke, GA 31321 and is currently estimated at $179,157, approximately $155 per square foot. 867 N Main St is a home with nearby schools including Lanier Primary School, Bryan County Elementary School, and Bryan County Middle School.
Ownership History
Date
Name
Owned For
Owner Type
Purchase Details
Closed on
Feb 23, 2021
Sold by
Shuman William Craig
Bought by
Shuman William Craig and Shuman Brandy B
Current Estimated Value
Home Financials for this Owner
Home Financials are based on the most recent Mortgage that was taken out on this home.
Original Mortgage
$109,525
Outstanding Balance
$11,629
Interest Rate
2.7%
Mortgage Type
New Conventional
Estimated Equity
$167,528
Purchase Details
Closed on
Dec 18, 2020
Sold by
Blackburn Britany S
Bought by
Shuman William Craig
Purchase Details
Closed on
Jun 22, 2012
Sold by
Green Tree Servicing Llc
Bought by
Shuman Britany N and Calloway Jessie S
Purchase Details
Closed on
May 1, 2012
Sold by
Doyle Joseph Danny
Bought by
Green Tree Servicing Llc
Purchase Details
Closed on
Jul 12, 2001
Sold by
Doyle Joseph Danny
Bought by
Doyle Joseph Danny
Purchase Details
Closed on
Dec 1, 1999
Bought by
Doyle Joseph Danny
Purchase Details
Closed on
Jul 1, 1967
Create a Home Valuation Report for This Property
The Home Valuation Report is an in-depth analysis detailing your home's value as well as a comparison with similar homes in the area
Home Values in the Area
Average Home Value in this Area
Purchase History
| Date | Buyer | Sale Price | Title Company |
|---|---|---|---|
| Shuman William Craig | -- | -- | |
| Shuman William Craig | $72,500 | -- | |
| Shuman Britany N | $66,640 | -- | |
| Green Tree Servicing Llc | -- | -- | |
| Doyle Joseph Danny | -- | -- | |
| Doyle Joseph Danny | $20,000 | -- | |
| -- | -- | -- |
Source: Public Records
Mortgage History
| Date | Status | Borrower | Loan Amount |
|---|---|---|---|
| Open | Shuman William Craig | $109,525 |
Source: Public Records
Tax History Compared to Growth
Tax History
| Year | Tax Paid | Tax Assessment Tax Assessment Total Assessment is a certain percentage of the fair market value that is determined by local assessors to be the total taxable value of land and additions on the property. | Land | Improvement |
|---|---|---|---|---|
| 2024 | $1,929 | $51,080 | $4,040 | $47,040 |
| 2023 | $1,697 | $33,640 | $4,640 | $29,000 |
| 2022 | $959 | $27,200 | $2,840 | $24,360 |
| 2021 | $1,032 | $28,800 | $2,840 | $25,960 |
| 2020 | $998 | $28,600 | $2,640 | $25,960 |
| 2019 | $1,044 | $28,680 | $2,640 | $26,040 |
| 2018 | $1,051 | $28,680 | $2,640 | $26,040 |
| 2017 | $998 | $29,040 | $2,640 | $26,400 |
| 2016 | $989 | $28,600 | $2,640 | $25,960 |
| 2015 | $979 | $28,080 | $2,640 | $25,440 |
| 2014 | $989 | $28,400 | $2,640 | $25,760 |
Source: Public Records
Map
Nearby Homes
- 3302 Georgia 67
- 001 Georgia 67
- 182 Rogers Rd
- 168 Rogers Rd
- 0 Fabled Ln Unit LOT 4
- 802 Ash Branch Rd
- 226 Strickland St
- 219 N College St
- 40 Circle Dr
- 0 Warnell St Unit 10512255
- 25 Hamilton Ct
- 55 Kayton Ct
- 231 Warnell St
- 0 Highway 119 Unit SA330839
- 0 Hwy 119 N Unit 298325
- 301 Park Ave
- 0 Highway 67 Unit 10616006
- 0 U S Highway 280
- 0 Georgia 67 Unit 24588527
- 142 Bill Brown Rd