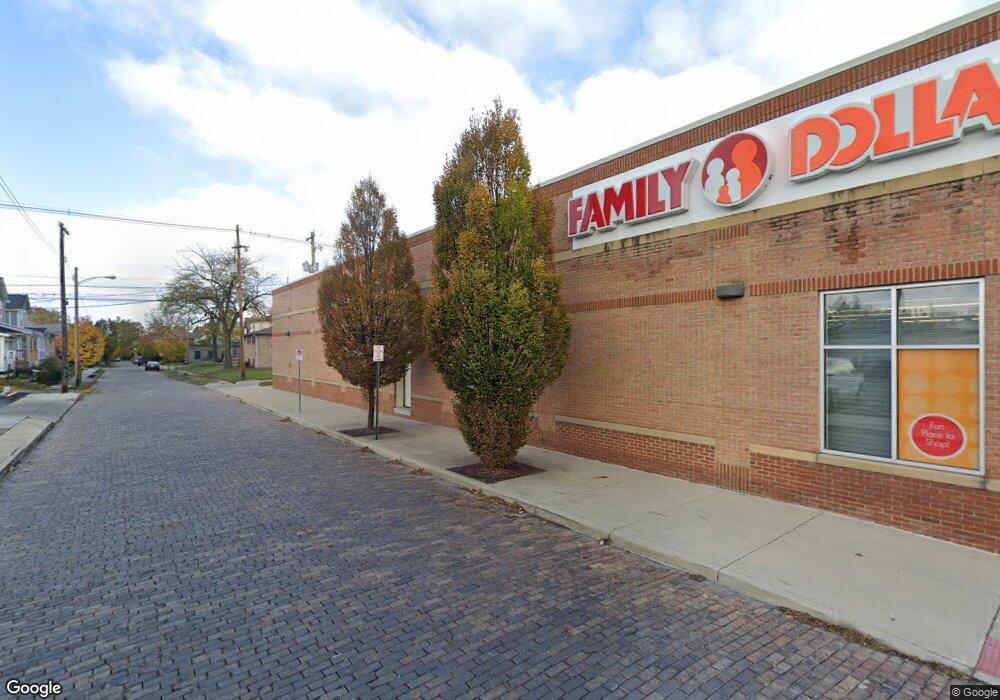
867 Parsons Ave Columbus, OH 43206
Schumacher Place NeighborhoodEstimated Value: $798,902
Studio
--
Bath
600
Sq Ft
$1,332/Sq Ft
Est. Value
About This Home
This home is located at 867 Parsons Ave, Columbus, OH 43206 and is currently estimated at $798,902, approximately $1,331 per square foot. 867 Parsons Ave is a home located in Franklin County with nearby schools including Livingston Elementary School, South High School, and South Columbus Preparatory Academy.
Ownership History
Date
Name
Owned For
Owner Type
Purchase Details
Closed on
May 7, 2021
Sold by
Nationwide Childrens Hospital
Bought by
Ge Investment Group Llc
Current Estimated Value
Purchase Details
Closed on
Aug 11, 2008
Sold by
Shamansky Robert N
Bought by
Nationwide Childrents Hospital
Purchase Details
Closed on
Jun 17, 2008
Sold by
Shamansky Gale M
Bought by
Shamansky Robert N
Purchase Details
Closed on
Nov 22, 2002
Sold by
867 Parsons Avenue Llc
Bought by
Shamansky Robert N
Purchase Details
Closed on
Oct 18, 2002
Sold by
Shamansky Samuel H and Shamansky Harry T
Bought by
Shamansky Robert N
Purchase Details
Closed on
Jun 5, 2002
Sold by
Keybank National Assn
Bought by
Shamansky Harry T
Purchase Details
Closed on
Mar 25, 2002
Sold by
Shamansky Robert N
Bought by
867 Parsons Avenue Llc
Purchase Details
Closed on
Jun 1, 1986
Create a Home Valuation Report for This Property
The Home Valuation Report is an in-depth analysis detailing your home's value as well as a comparison with similar homes in the area
Home Values in the Area
Average Home Value in this Area
Purchase History
| Date | Buyer | Sale Price | Title Company |
|---|---|---|---|
| Ge Investment Group Llc | $711,600 | Chase T&E Svcs Llc | |
| Nationwide Childrents Hospital | -- | None Available | |
| Columbus Jewish Foundation | -- | Attorney | |
| Shamansky Robert N | -- | None Available | |
| Shamansky Robert N | -- | -- | |
| Shamansky Robert N | $7,200 | -- | |
| Shamansky Harry T | -- | -- | |
| Shamansky Samuel H | -- | -- | |
| 867 Parsons Avenue Llc | -- | -- | |
| -- | -- | -- |
Source: Public Records
Tax History
| Year | Tax Paid | Tax Assessment Tax Assessment Total Assessment is a certain percentage of the fair market value that is determined by local assessors to be the total taxable value of land and additions on the property. | Land | Improvement |
|---|---|---|---|---|
| 2025 | $18,801 | $253,300 | $32,200 | $221,100 |
| 2024 | $18,801 | $253,300 | $32,200 | $221,100 |
| 2023 | $18,503 | $253,295 | $32,200 | $221,095 |
| 2022 | $18,678 | $249,070 | $31,470 | $217,600 |
| 2021 | $18,759 | $249,070 | $31,470 | $217,600 |
| 2020 | $18,630 | $249,070 | $31,470 | $217,600 |
| 2019 | $18,650 | $226,450 | $28,630 | $197,820 |
| 2018 | $18,486 | $226,450 | $28,630 | $197,820 |
| 2017 | $18,629 | $226,450 | $28,630 | $197,820 |
| 2016 | $19,798 | $227,500 | $28,630 | $198,870 |
| 2015 | $18,382 | $227,500 | $28,630 | $198,870 |
| 2014 | $18,373 | $227,500 | $28,630 | $198,870 |
| 2013 | $9,104 | $227,500 | $28,630 | $198,870 |
Source: Public Records
Map
Nearby Homes
- 472 E Whittier St
- 432 E Kossuth St
- 841 Ann St
- 644 Stanley Ave
- 473 E Sycamore St
- 632 E Whittier St
- 640 E Whittier St
- 781 Bruck St
- 320 E Columbus St
- 1010 Bruck St
- 901 Heyl Ave
- 664 Siebert St
- 792 S 18th St
- 514 Cline St
- 516 Cline St
- 510 Cline St
- 512 Cline St
- 707 Sycamore Place Unit 707
- 253 E Kossuth St Unit 253-H
- 735 Reinhard Ave
- 504 E Kossuth St
- 509 E Kossuth St
- 498 E Kossuth St
- 496-498 E Kossuth St
- 496 E Kossuth St
- 503 E Kossuth St
- 845 Parsons Ave
- 497 E Kossuth St
- 492 E Kossuth St
- 895 Parsons Ave
- 507 E Columbus St
- 485 E Kossuth St
- 511 E Columbus St
- 484 E Kossuth St
- 488 E Kossuth St Unit 100
- 488 E Kossuth St Unit 102
- 488 E Kossuth St
- 505 E Columbus St
- 509 E Columbus St
- 860 Parsons Ave