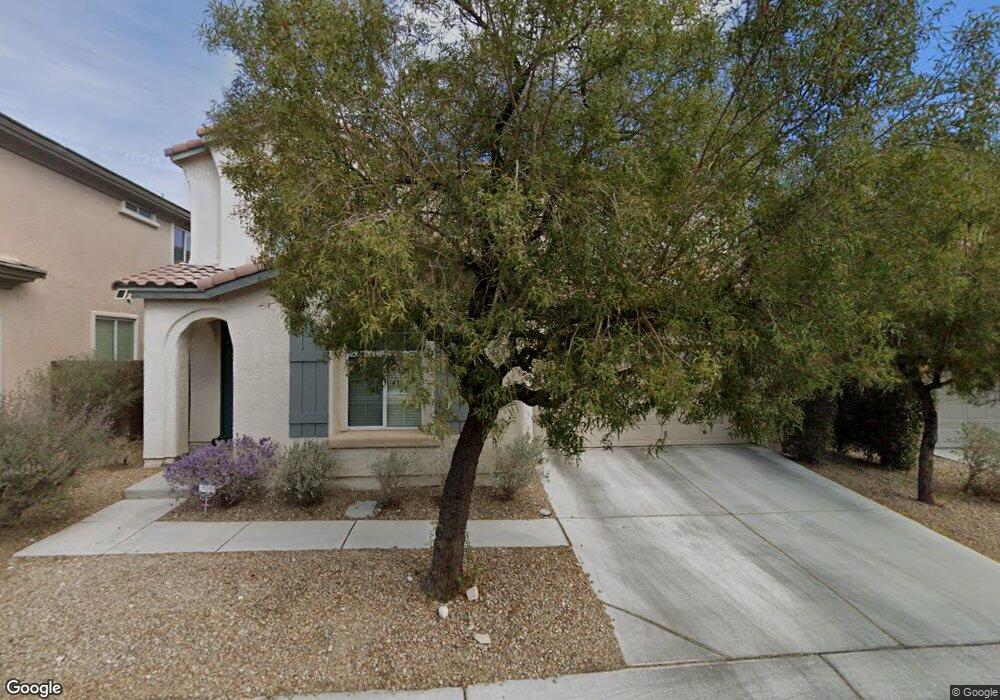
8670 Livermore Valley Ave Las Vegas, NV 89178
Mountains Edge NeighborhoodEstimated Value: $510,886 - $575,000
4
Beds
3
Baths
2,631
Sq Ft
$206/Sq Ft
Est. Value
About This Home
This home is located at 8670 Livermore Valley Ave, Las Vegas, NV 89178 and is currently estimated at $541,722, approximately $205 per square foot. 8670 Livermore Valley Ave is a home located in Clark County with nearby schools including William V. Wright Elementary School, Desert Oasis High School, and Doral Academy Cactus.
Ownership History
Date
Name
Owned For
Owner Type
Purchase Details
Closed on
Jun 5, 2014
Sold by
Kim Eun Sub
Bought by
Kim Francis
Current Estimated Value
Purchase Details
Closed on
Dec 7, 2009
Sold by
Wong Winnie C and Tsang Kit Hung
Bought by
Kim Jun Ja and Kim Eun Sub
Home Financials for this Owner
Home Financials are based on the most recent Mortgage that was taken out on this home.
Original Mortgage
$146,250
Interest Rate
4.88%
Mortgage Type
New Conventional
Purchase Details
Closed on
May 5, 2006
Sold by
Woodside Via Ventura Llc
Bought by
Wong Winnie C and Tsang Kit Hung
Home Financials for this Owner
Home Financials are based on the most recent Mortgage that was taken out on this home.
Original Mortgage
$296,580
Interest Rate
6.3%
Mortgage Type
Fannie Mae Freddie Mac
Create a Home Valuation Report for This Property
The Home Valuation Report is an in-depth analysis detailing your home's value as well as a comparison with similar homes in the area
Home Values in the Area
Average Home Value in this Area
Purchase History
| Date | Buyer | Sale Price | Title Company |
|---|---|---|---|
| Kim Francis | -- | Accommodation | |
| Kim Jun Ja | $195,000 | Fidelity National Title Las | |
| Wong Winnie C | $370,725 | Chicago Title |
Source: Public Records
Mortgage History
| Date | Status | Borrower | Loan Amount |
|---|---|---|---|
| Previous Owner | Kim Jun Ja | $146,250 | |
| Previous Owner | Wong Winnie C | $296,580 |
Source: Public Records
Tax History Compared to Growth
Tax History
| Year | Tax Paid | Tax Assessment Tax Assessment Total Assessment is a certain percentage of the fair market value that is determined by local assessors to be the total taxable value of land and additions on the property. | Land | Improvement |
|---|---|---|---|---|
| 2025 | $2,368 | $147,431 | $36,750 | $110,681 |
| 2024 | $2,299 | $147,431 | $36,750 | $110,681 |
| 2023 | $2,299 | $139,470 | $35,000 | $104,470 |
| 2022 | $2,447 | $123,081 | $28,000 | $95,081 |
| 2021 | $2,266 | $116,519 | $26,250 | $90,269 |
| 2020 | $2,101 | $116,578 | $27,300 | $89,278 |
| 2019 | $1,969 | $110,757 | $23,100 | $87,657 |
| 2018 | $1,834 | $101,177 | $18,900 | $82,277 |
| 2017 | $2,819 | $96,118 | $17,850 | $78,268 |
| 2016 | $1,717 | $80,371 | $14,000 | $66,371 |
| 2015 | $1,717 | $73,939 | $11,900 | $62,039 |
| 2014 | $1,663 | $55,023 | $7,000 | $48,023 |
Source: Public Records
Map
Nearby Homes
- 8719 Mount Mira Loma Ave
- 8626 Anderson Dale Ave
- 9864 Maspalomas St
- 8733 Autumn Teal Ave
- 8823 Autumn Teal Ave
- 8547 Benidorm Ave
- 9539 Iris Flat Ct
- 7680 Pirouette Ave
- 7711 Pirouette Ave
- 7651 Pirouette Ave
- 7661 Pirouette Ave
- 7671 Pirouette Ave
- 7690 Pirouette Ave
- 8695 Canfield Canyon Ave
- 9524 New Utrecht St
- 9738 Elk Grove Valley St
- 8968 Horizon Hyatt Ave
- 8974 English Falls Way
- 8396 Waylon Ave
- 9715 Aleutian St
- 8662 Livermore Valley Ave
- 8678 Livermore Valley Ave
- 8667 Moreno Mountain Ave
- 8675 Moreno Mountain Ave
- 8659 Moreno Mountain Ave
- 8654 Livermore Valley Ave
- 8686 Livermore Valley Ave
- 9838 Mount Oroville Ct
- 8683 Moreno Mountain Ave
- 8651 Moreno Mountain Ave
- 9839 Dublin Valley St
- 8646 Livermore Valley Ave
- 8694 Livermore Valley Ave
- 9850 Mount Oroville Ct
- 9837 Mount Oroville Ct
- 8643 Moreno Mountain Ave
- 8691 Moreno Mountain Ave
- 9857 Dublin Valley St
- 9795 Logrondo St
- 8638 Livermore Valley Ave Unit 1