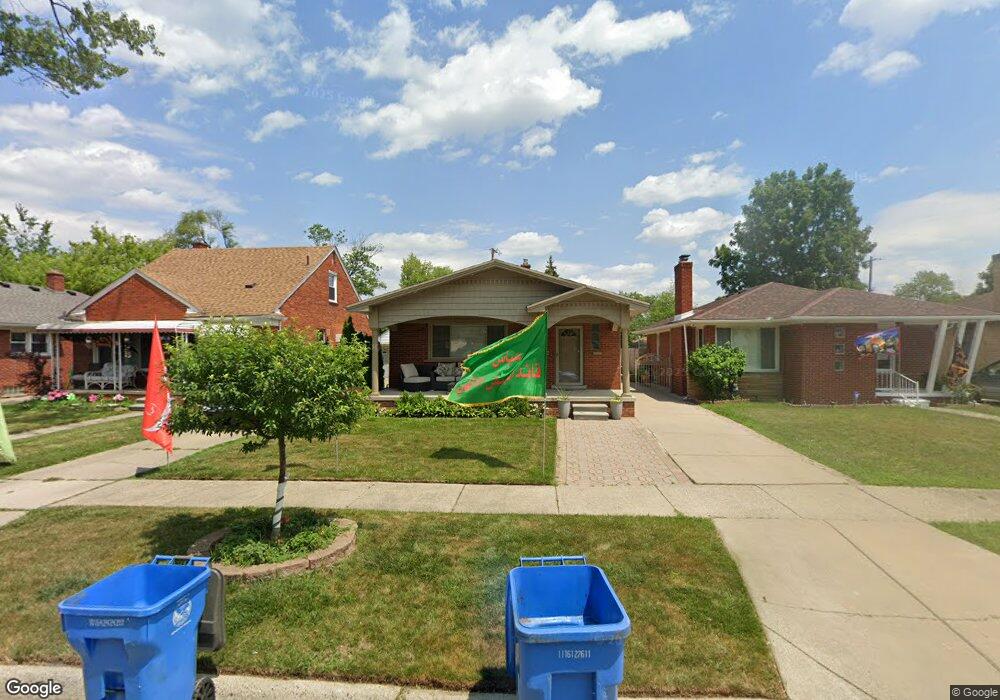
8672 Dale St Dearborn Heights, MI 48127
Estimated Value: $195,372 - $242,000
3
Beds
1
Bath
1,066
Sq Ft
$204/Sq Ft
Est. Value
About This Home
This home is located at 8672 Dale St, Dearborn Heights, MI 48127 and is currently estimated at $217,093, approximately $203 per square foot. 8672 Dale St is a home located in Wayne County with nearby schools including River Oaks Elementary School, Smith Middle School, and Dearborn High School.
Ownership History
Date
Name
Owned For
Owner Type
Purchase Details
Closed on
Nov 4, 2022
Sold by
Mroue Hassan and Mroue Fatme
Bought by
Saad Mohamad and Saad Hassan
Current Estimated Value
Purchase Details
Closed on
Dec 27, 2016
Sold by
Kassem Fatin
Bought by
Beydoun Fatme
Home Financials for this Owner
Home Financials are based on the most recent Mortgage that was taken out on this home.
Original Mortgage
$57,997
Interest Rate
3.87%
Mortgage Type
FHA
Purchase Details
Closed on
Jun 5, 2009
Sold by
Sayed Mohamed H and Bazzi Faten
Bought by
Kassem Fatin
Purchase Details
Closed on
Dec 6, 1996
Sold by
Horn Henrietta J and Horn Henia
Bought by
Mohamed H Sayed
Create a Home Valuation Report for This Property
The Home Valuation Report is an in-depth analysis detailing your home's value as well as a comparison with similar homes in the area
Home Values in the Area
Average Home Value in this Area
Purchase History
| Date | Buyer | Sale Price | Title Company |
|---|---|---|---|
| Saad Mohamad | -- | Land Title | |
| Mroue Hassan | -- | -- | |
| Beydoun Fatme | $60,000 | Title Source Inc | |
| Kassem Fatin | $37,000 | Bell Title | |
| Mohamed H Sayed | $84,500 | -- |
Source: Public Records
Mortgage History
| Date | Status | Borrower | Loan Amount |
|---|---|---|---|
| Previous Owner | Beydoun Fatme | $57,997 |
Source: Public Records
Tax History Compared to Growth
Tax History
| Year | Tax Paid | Tax Assessment Tax Assessment Total Assessment is a certain percentage of the fair market value that is determined by local assessors to be the total taxable value of land and additions on the property. | Land | Improvement |
|---|---|---|---|---|
| 2025 | $1,771 | $88,800 | $0 | $0 |
| 2024 | $1,771 | $81,600 | $0 | $0 |
| 2023 | $1,581 | $71,600 | $0 | $0 |
| 2022 | $2,121 | $60,800 | $0 | $0 |
| 2021 | $2,377 | $56,500 | $0 | $0 |
| 2019 | $2,356 | $46,800 | $0 | $0 |
| 2018 | $1,585 | $38,400 | $0 | $0 |
| 2017 | $1,333 | $36,800 | $0 | $0 |
| 2016 | $2,186 | $34,300 | $0 | $0 |
| 2015 | $3,024 | $32,000 | $0 | $0 |
| 2013 | $2,930 | $30,200 | $0 | $0 |
| 2010 | -- | $37,900 | $0 | $0 |
Source: Public Records
Map
Nearby Homes