868 Cape St Ashfield, MA 01330
Ashfield NeighborhoodEstimated Value: $221,000 - $371,000
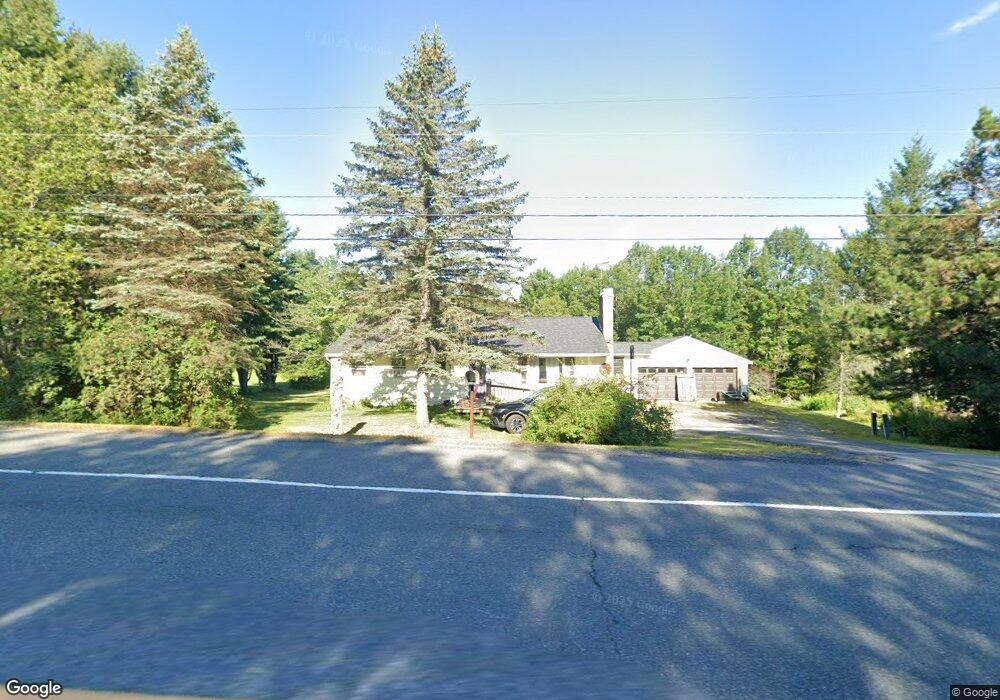
About This Home
This home is located at 868 Cape St, Ashfield, MA 01330 and is currently estimated at $304,847, approximately $236 per square foot. 868 Cape St is a home located in Franklin County with nearby schools including Mohawk Trail Regional High School.
Ownership History
We collect this data history from publicly available records. To have your information removed, we recommend requesting removal directly through your county’s website.
Purchase Details
Purchase Details
Home Financials for this Owner
Home Financials are based on the most recent Mortgage that was taken out on this home.Home Values in the Area
Average Home Value in this Area
Purchase History
We collect this data history from publicly available records. To have your information removed, we recommend requesting removal directly through your county’s website.
| Date | Buyer | Sale Price | Title Company |
|---|---|---|---|
| -- | None Available | ||
| -- | None Available | ||
| $95,000 | -- | ||
| $95,000 | -- |
Mortgage History
We collect this data history from publicly available records. To have your information removed, we recommend requesting removal directly through your county’s website.
| Date | Status | Borrower | Loan Amount |
|---|---|---|---|
| Previous Owner | $20,000 | ||
| Previous Owner | $76,000 |
Tax History
We collect this data history from publicly available records. To have your information removed, we recommend requesting removal directly through your county’s website.
| Year | Tax Paid | Tax Assessment Tax Assessment Total Assessment is a certain percentage of the fair market value that is determined by local assessors to be the total taxable value of land and additions on the property. | Land | Improvement |
|---|---|---|---|---|
| 2025 | $3,669 | $272,600 | $82,800 | $189,800 |
| 2024 | $3,747 | $256,500 | $82,800 | $173,700 |
| 2023 | $3,615 | $205,300 | $66,200 | $139,100 |
| 2022 | $3,346 | $192,500 | $62,900 | $129,600 |
| 2021 | $0 | $191,300 | $62,900 | $128,400 |
| 2020 | $3,187 | $191,300 | $62,900 | $128,400 |
| 2019 | $3,103 | $180,800 | $58,800 | $122,000 |
| 2018 | $3,106 | $180,800 | $58,800 | $122,000 |
| 2017 | $2,897 | $178,600 | $57,900 | $120,700 |
| 2016 | $2,800 | $170,300 | $57,900 | $112,400 |
| 2015 | $2,720 | $170,300 | $57,900 | $112,400 |
| 2014 | $2,912 | $180,200 | $54,600 | $125,600 |
Map
- 193 Norton Hill Rd
- 295 Main St
- 14 South St
- 0 Sears Rd Unit 73373850
- 197 Buckland Rd
- 333 Ranney Corner Rd
- 128 Spruce Corner Rd
- 311 Cummington Rd
- 0 Old Stage Rd Unit 73528367
- 78 Shaw Rd
- 0 N Bear River Rd Unit 73485981
- Lot 60 Apple Valley Rd
- 1230 Main Poland Rd
- 486 Old Stage Rd
- 54 E Main St
- 36 Campbell Rd
- 162 Nash Rd
- 44 Aberdeen Rd
- 278 E Main St
- 296 E Main St
- 868 Cape St Unit 1
- 860 Cape St
- 838 Cape St
- 904 Cape St
- 827 Cape St
- 896 Cape St
- 9 Dyer Rd
- 1049 Cape St
- 769-A Cape St
- 44 ACRES Spruce Corner
- 441 Cape St
- 769-B Cape St
- Lots 6&7 Spruce Corner Rd
- 199D Stonewall Dr
- 725 Suburban Dr
- 199J Stonewall Dr
- 694 Suburban Dr
- 199H Stonewall Dr
- 118 Spruce Corner Rd
- 199E Stonewall Dr
Ask me questions while you tour the home.