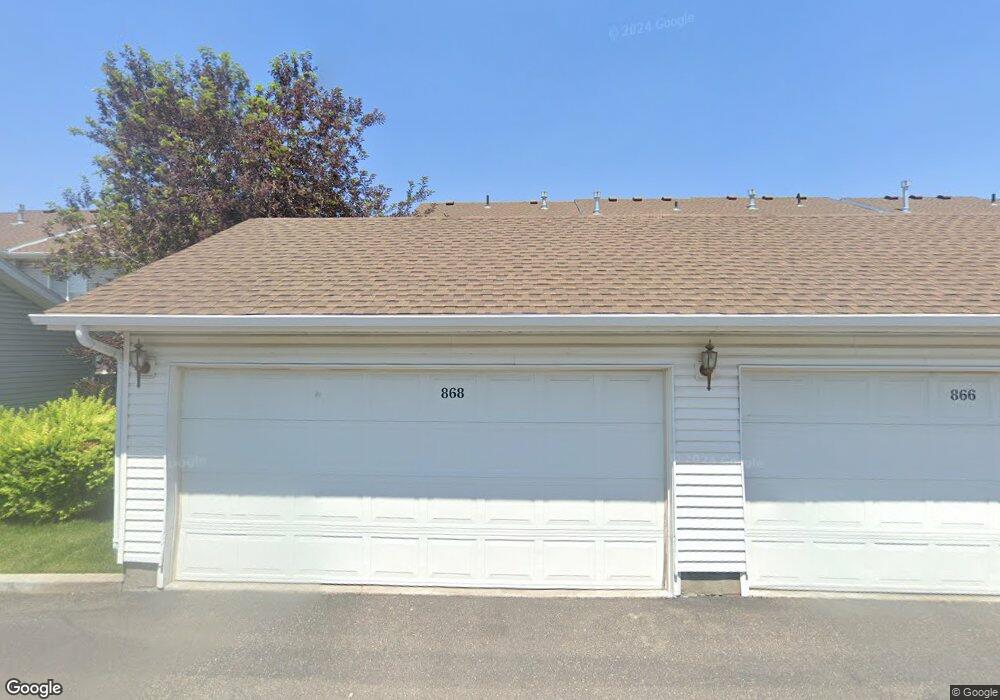
868 Capital Ln Rexburg, ID 83440
Estimated Value: $259,000 - $286,000
3
Beds
2
Baths
1,368
Sq Ft
$200/Sq Ft
Est. Value
About This Home
This home is located at 868 Capital Ln, Rexburg, ID 83440 and is currently estimated at $273,421, approximately $199 per square foot. 868 Capital Ln is a home located in Madison County with nearby schools including Burton Elementary School, Kennedy Elementary School, and Madison Junior High School.
Ownership History
Date
Name
Owned For
Owner Type
Purchase Details
Closed on
Mar 7, 2024
Sold by
Blanchard Bruce W and Blanchard Teresa
Bought by
Briggs Loriann Tirrell
Current Estimated Value
Home Financials for this Owner
Home Financials are based on the most recent Mortgage that was taken out on this home.
Original Mortgage
$125,000
Outstanding Balance
$122,944
Interest Rate
6.69%
Mortgage Type
New Conventional
Estimated Equity
$150,477
Purchase Details
Closed on
Aug 15, 2017
Sold by
Blanchard Jacob
Bought by
Blanchard Bruce W and Blanchard Teresa
Purchase Details
Closed on
Nov 17, 2011
Sold by
Federal Home Loan Mortgage Corporation
Bought by
Blanchard Jacob
Purchase Details
Closed on
Oct 25, 2007
Sold by
Slatter Sarah
Bought by
Slatter Max
Purchase Details
Closed on
Oct 24, 2007
Sold by
Brown Kevin D and Brown Jaclynn R
Bought by
Slatter Max
Purchase Details
Closed on
May 31, 2007
Sold by
Georgetown Development Inc
Bought by
Brown Kevin D and Brown Jaclun R
Create a Home Valuation Report for This Property
The Home Valuation Report is an in-depth analysis detailing your home's value as well as a comparison with similar homes in the area
Purchase History
| Date | Buyer | Sale Price | Title Company |
|---|---|---|---|
| Briggs Loriann Tirrell | -- | Alliance Title | |
| Blanchard Bruce W | -- | Alliance Title Rexburg | |
| Blanchard Jacob | -- | -- | |
| Slatter Max | -- | -- | |
| Slatter Max | -- | -- | |
| Brown Kevin D | -- | -- |
Source: Public Records
Mortgage History
| Date | Status | Borrower | Loan Amount |
|---|---|---|---|
| Open | Briggs Loriann Tirrell | $125,000 |
Source: Public Records
Tax History
| Year | Tax Paid | Tax Assessment Tax Assessment Total Assessment is a certain percentage of the fair market value that is determined by local assessors to be the total taxable value of land and additions on the property. | Land | Improvement |
|---|---|---|---|---|
| 2025 | $2,629 | $252,406 | $35,000 | $217,406 |
| 2024 | $2,664 | $258,947 | $35,000 | $223,947 |
| 2023 | $2,664 | $252,321 | $35,000 | $217,321 |
| 2022 | $3,081 | $245,696 | $35,000 | $210,696 |
| 2021 | $3,026 | $196,764 | $20,000 | $176,764 |
| 2020 | $2,520 | $179,698 | $20,000 | $159,698 |
| 2019 | $2,413 | $156,520 | $15,000 | $141,520 |
| 2018 | $2,202 | $130,553 | $15,000 | $115,553 |
| 2017 | $2,151 | $124,062 | $15,000 | $109,062 |
| 2016 | $2,129 | $124,062 | $15,000 | $109,062 |
| 2015 | $1,864 | $108,005 | $0 | $0 |
| 2013 | -- | $109,903 | $0 | $0 |
Source: Public Records
Map
Nearby Homes
- 875 Capital Ln
- 880 Liberty Ln
- 871 Widdison Ln
- 774 Griffin St
- 758 Yost St
- 885 W Main St Unit Lot 2
- 124 Tamarack Ave
- 470 Sunflower Rd
- 530 Sunflower Rd
- 580 Cook St
- 565 Pioneer Rd Unit 215
- 582 Legacy Ln
- 595 Legacy Ln
- 2240 Summers Dr Unit 102
- 2240 Summers Dr Unit 201
- 2240 Summers Dr Unit 203
- 2240 Summers Dr Unit 104
- 596 Sunflower Rd Unit 596
- 610 Sunflower Rd
- 603 Countryside Ave
- 868 Capital Ave
- 866 Capital Ave
- 866 Capital Ln
- 864 Capital Ln Unit 80
- 864 Capital Ln
- 864 Capital Ave
- 870 Capital Ln
- 870 Capital Ave Unit 56
- 862 Capital Ln
- 862 Capital Ave
- 872 Capital Ave Unit 55
- 860 Capital Ave
- 874 Capital Ave
- 874 Capital Ln
- 876 Capital Ave Unit 53
- 869 Capital Ln
- 867 Capital Ave
- 865 Capital Ave
- 878 Capital Ave Unit 52
- 869 Capital Ave Unit 65
Your Personal Tour Guide
Ask me questions while you tour the home.